2175
Technical Committee 208 /
Comité technique 208
5% clay; 33% silt; 50% fine sand, and 12% medium and thick
sand; showing a strong reduction in the portions of clay, and
increases in the fine sand portions. Results indicate that the
particles of clay in this soil are aggregated in their natural state.
The soil-water characteristic curve obtained through the
paper filter method, Haines funnel and Richard´s chamber, is
presented in Figure 2. The format of the curve displays a saddle
aspect, allowing it to be divided into three distinct stretches. The
curves indicate an initial air entry suction of 1 kPa, where de-
saturation begins. After that, a region approximating horizontal
is observed, where suction varies from 20 to 200 kPa. In the last
stretch, a second air entry value is depicted, where the water
content starts to diminish with the increase in suction due to the
removal of water from the soil micro pores (see more
information in Silva and Coutinho, 2009).
0
5
10
15
20
25
30
35
40
45
50
55
0,1
1
10 100 1000 10000 100000
Suction (kPa)
Gravimetric water content (%)
Paper filter - drying
Paper filter - wetting
Haines funnel
Richard´s chamber
Figure 2. Soil-water characteristic curve from mature residual soil
from Camaragibe-PE - Silva and Coutinho (2009)
The shear strength was determined using conventional and
controlled suction direct shear tests. The equipment used
consisted of a conventional press, adapted for use with a cell
that allowed the imposition and control of suction through the
principle of translation of axes.
The suction is imposed on the soil by the difference between
air pressure supplied by hydrogen applied through an air valve,
and the water column maintained in the reservoir fixed on top of
the press. The tension is applied through a system of hanging
weights, identical to the conventional direct shear tests. The air
pressure was applied only under the weight of a charge
transference plate, and it was maintained during 10 days. The
horizontal force was determined through a load ring. The
suctions employed were 25, 100, 300 and 500 kPa. After this
period (of suction equilibrium), specific normal stress values
were applied, accompanying the deformations up to
stabilization. The normal stresses adopted were 50, 100, 150
and 200 kPa, and they were maintained for a minimum of 24
hours. Square samples were used that measured 50 mm or 100
mm the side, and 22 mm or 44 mm in height.
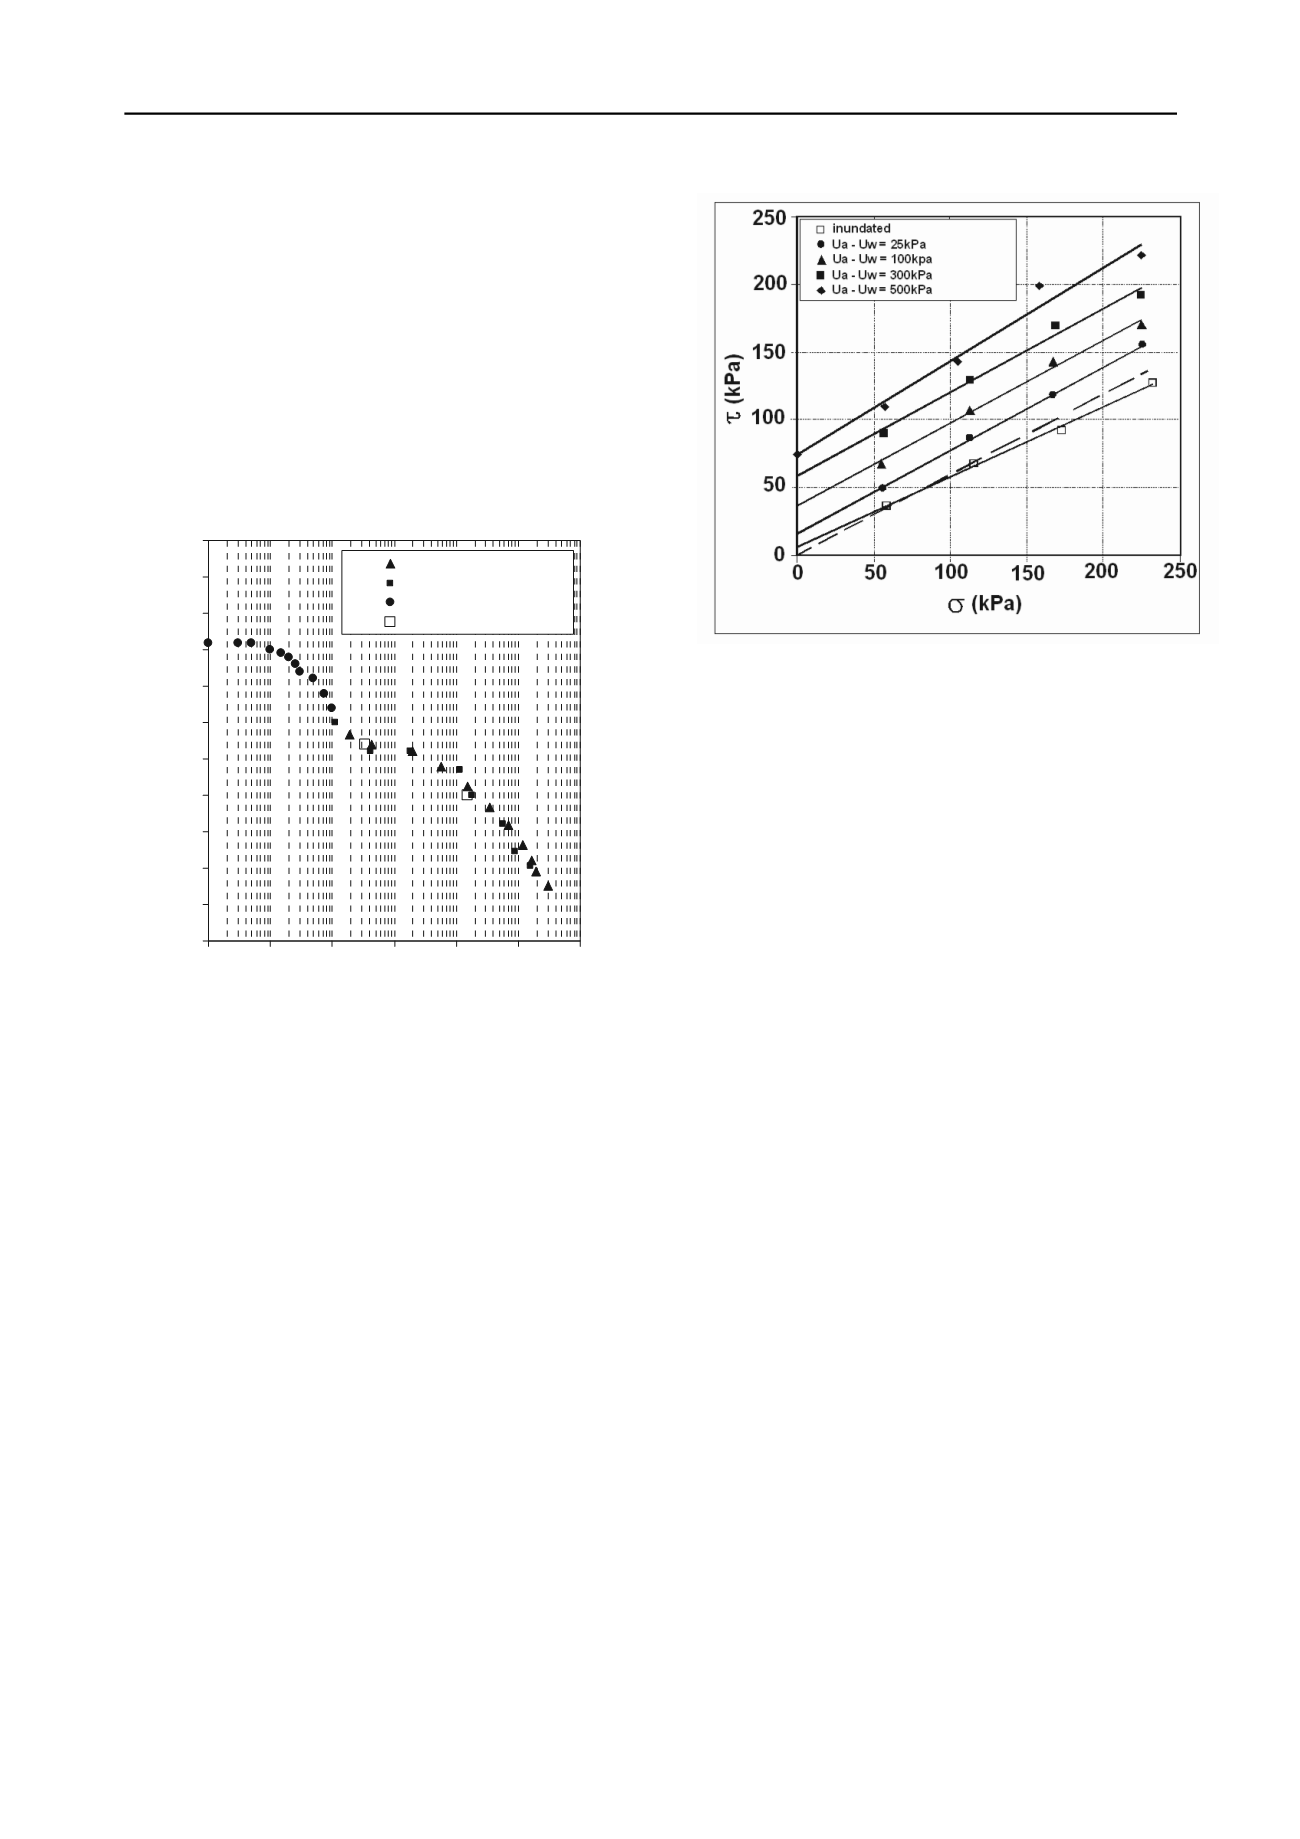
The shear strength envelopes in the plain
,
for the
suction values of 25, 100, 300 and 500 kPa are represented in
Figure 3. Envelopes considering suction of 0 kPa, obtained
through conventional direct shear tests in the submerged
condition, are also presented in this figure. It can be observed
that the friction angle, in general, is close to 31°. The results
indicate that the envelopes are near to linear in the stress range.
Figure 3. Shear strength envelopes for different values of suction –
mature residual soil from Camaragibe.
3 STABILITY ANALYSIS
Through the field investigation, together with flow and stability
studies (failure and post failure conditions), a clear perception
and understanding of the landslide mechanism was made
possible. In this paper, only results corresponding to the failure
state are presented. The slope stability evaluation was
performed using Spencer method with consideration given to
the original topography for the main cross section, as a two-
dimensional saturated stability analysis, and considering the
“actual” failure surface, along with the pore pressure
distribution obtained from the flow analysis, and the
geotechnical parameters obtained from laboratory testing
(conventional direct shear tests in the submerged condition).
Due to the intense rainfall during the failure period, the water
level was considered at the surface position from the results
produced through instrumentation and field observation, with
the materials being in a saturated condition (Silva et al. 2009).
Flow analysis was performed for the failure condition,
considering all the information from the studies, including the
geotechnical profile, the geotechnical parameters of hydraulic
conductivity for the materials composing the Barreiras
Formation and residual soils, along with the rainfall and water
level conditions. A summary of pore pressure distribution
results is shown in Figure 4. Higher positive pore pressure
values in the SP-01 and SP-02 regions were obtained showing
ascends flow. These results are due to the variability of the soil
profile and differences among the hydraulic conductivity values
occurring for the materials. This condition is in conformity with
water flow observed in this area during the period of intense
rainfall.
With the flow analysis results that were provided, stability
evaluation for global failure was initially performed (one-step
failure) for the complete slope cross-section. The safety factor
result was 1.278, showed not to be a condition for failure.
Stability analysis was then performed considering the
possibility of two-step failure, taking into account the
concentrated high pore pressure values around the SP-01 region.
(Ua–Uw)= 0kPa
c = 9,7kpa
26,3°
R
2
= 0,996
(Ua–Uw)= 0kPa
c = 0,0kpa
,0°
estimated
(Ua–Uw)= 25kPa
c = 15,4kpa
31,6°
R
2
= 0,999
(Ua–Uw)= 100kPa
c = 36,5kpa
31,3°
R
2
= 0,991
(Ua–Uw)= 300kPa
c = 58,7kpa
31,5°
R
2
= 0,987
(Ua–Uw)= 500kPa
c = 74,7kpa
34,4°
R
2
= 0,956


