2167
Technical Committee 208 /
Comité technique 208
Fi
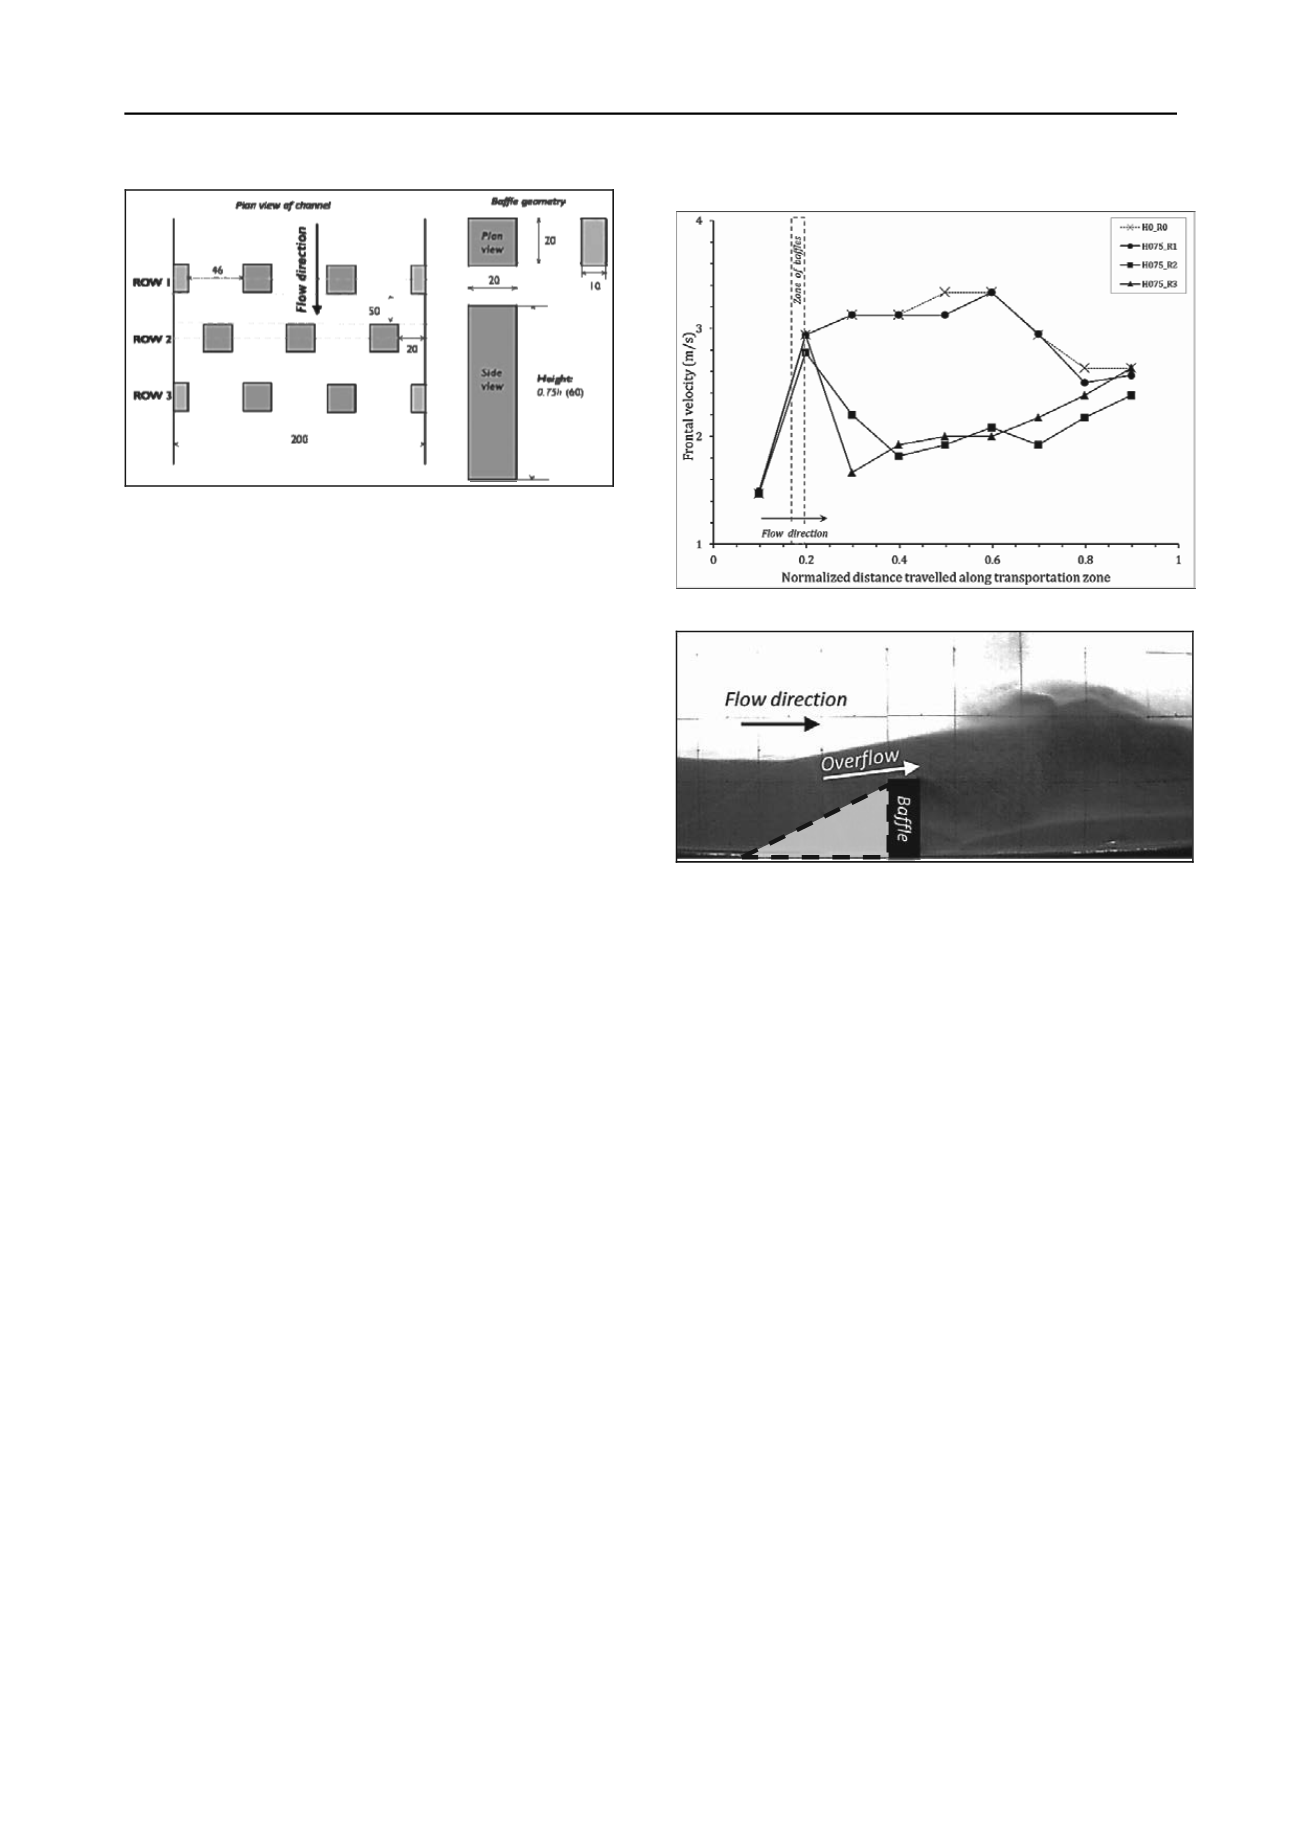
gure 3. Baffle arrangement and dimensions (all dimensions in mm)
5.2
Frontal velocity
The measured debris frontal velocity profiles of different tests
are compared and shown in Fig. 4. The measured debris frontal
velocity is plotted against normalised distance travelled along
the transportation zone (
N
d
), which is the ratio of distance
travelled by the debris front along the 5 meter flume. The
debris flow direction is from left to right on x-axis and the
location of the baffles along the transportation zone is shown as
a vertical dashed line.
The frontal debris velocity profile of the control test
(H0_R0) is shown as a reference for comparison purposes. The
debris frontal velocity of the control test rapidly increases upon
release from the storage container. At
N
d
= 0.2, a steady debris
flow profile develops, beyond
N
d
= 0.6, the debris frontal
velocity begins to decrease. A similar debris velocity profile is
observed in the experiment of one-row baffle test (H075_R1).
However, for the two-row and three-row baffle tests, a
prominent debris velocity reduction at the immediate
downstream of the baffle groups was observed. The velocity
profile rapidly decreases to less than 2 m/s after which it
gradually increases beyond
N
d
= 0.3.
Results show that one row of baffles (H075_R1) exhibits
negligible reduction in frontal debris velocity and the
propagation of the front is similar to unobstructed flow
(H0_R0). Obvious reduction in debris frontal velocity is
observed in the test with two rows of baffles (H075_R2) at the
location immediately downstream of the baffle group. This may
be attributed to the second row of staggered baffles intercepting
the discharge from the slits of the first row which dissipates
energy by disrupting streamlines of the flow (USFHA 2006).
The provision of an additional row of baffles (i.e. the third row;
test H075_R3 refers) exhibits a frontal debris velocity reduction
of 47% at
N
d
= 0.3 relative to the control experiment, whereas
two rows of baffles (H075_R2) only exhibits 30% reduction of
frontal debris velocity relative to the control experiment at
N
d
=
0.3. Moreover, the higher frontal velocity reduction may be
attributed to an additional third row of baffles which intercepts
discharge from the second row and disrupts streamlines.
Beyond
N
d
= 0.4, two rows (H075_R2) and three rows
(H075_R3) baffle groups exhibit a similar gradual increase in
frontal debris velocities. An increase in frontal debris velocities
may be attributed to subsequent excessive overflow of material
due to the use of shorter baffles (0.75 times the approach flow
depth) in this study. Overflow of debris in test H075_R1 is
captured from high speed imagery at the side of the flume
model and is shown in Fig. 5. Overflow does not experience
impedance and launches downstream (Barbolini et al. 2009) to
increase the momentum and thus the frontal velocity of the
flow. Overflow is hazardous particularly in situations where its
trajectory is not easily predicted. Johannesson (2001) surveyed
a torrent which had been deflected by a dam at Flateyri in north-
western Iceland and observed that the deflected stream came to
rest 100 m further downslope than the un-deflected part. The
mechanism of overflow appears to be significant and results
from this study require further interpretation.
Figure 4. Comparison of measured frontal velocity
Figure 5. Observed overflow dynamics (test H075_R1)
Deposition
5.3
Preliminary Particle Image Velocimetry (PIV) analysis
A preliminary Particle Image Velocimetry (PIV) analysis has
been carried out to investigate the flow dynamics and quantify
the flow velocity by interpreting the results of the flume test
using the Particle Image Velocimetry package (geoPIV)
developed by White et al (2003). This package is developed
based on close-range photogrammetry techniques capable of
tracing movements of soil grains captured in high-resolution
images. It produces displacement and velocity vectors of the
soil grains.
Typical flume test results for three rows of baffles produced
by geoPIV are presented in Figure 6. It shows the flow
dynamics of the debris upon hitting the baffles. Details of
debris run-up against baffles, deposition behind baffles and
filling up of the baffle zone and the subsequent overflowing
from the crest of baffles were captured. In general, the
preliminary results of the calculated velocity vectors by PIV
method are consistent with the measured debris frontal velocity
by the instrumented photo-sensors. Further PIV analysis will be
carried out in the next stage of interpretation of the experimental
study.


