2166
Proceedings of the 18
th
International Conference on Soil Mechanics and Geotechnical Engineering, Paris 2013
model dimension by the flume channel width and debris flow
depth (more details presented in Sect. 3). Kinematic similarity
describes the impedance resulting from baffle interaction which
is unknown and constitutes the objective of this study.
Dynamic similarity is attained by adopting the Froude number,
F
r
, which governs the behaviour of gravity-driven flows in open
channels. The
F
r
number is the ratio of inertial forces to the
gravitational forces and is given as follows:
���
where
v
= frontal velocity (m/s),
g
= gravitational acceleration
(m/s
2
), and
h
= debris flow depth (m).
Debris flow can be characterised with approaching
F
r
which
ranges from 0 to 4.5 (Arrattano et al. 1997, Hubl et al. 2009)
based on field observations. An
F
r
≈ 3 is adopted for
characterising the approaching flow in this study. This
corresponds to debris flow event with an approaching velocity
of about 10 m/s and flow depth of about 1 m. Details of the
scaling process and control test are discussed by Ng et al.
(2012).
2.2
Flume model
Further to flume experimental studies of debris flow
mechanisms (Law et al. 2008, Zhou et al. 2009) at the Hong
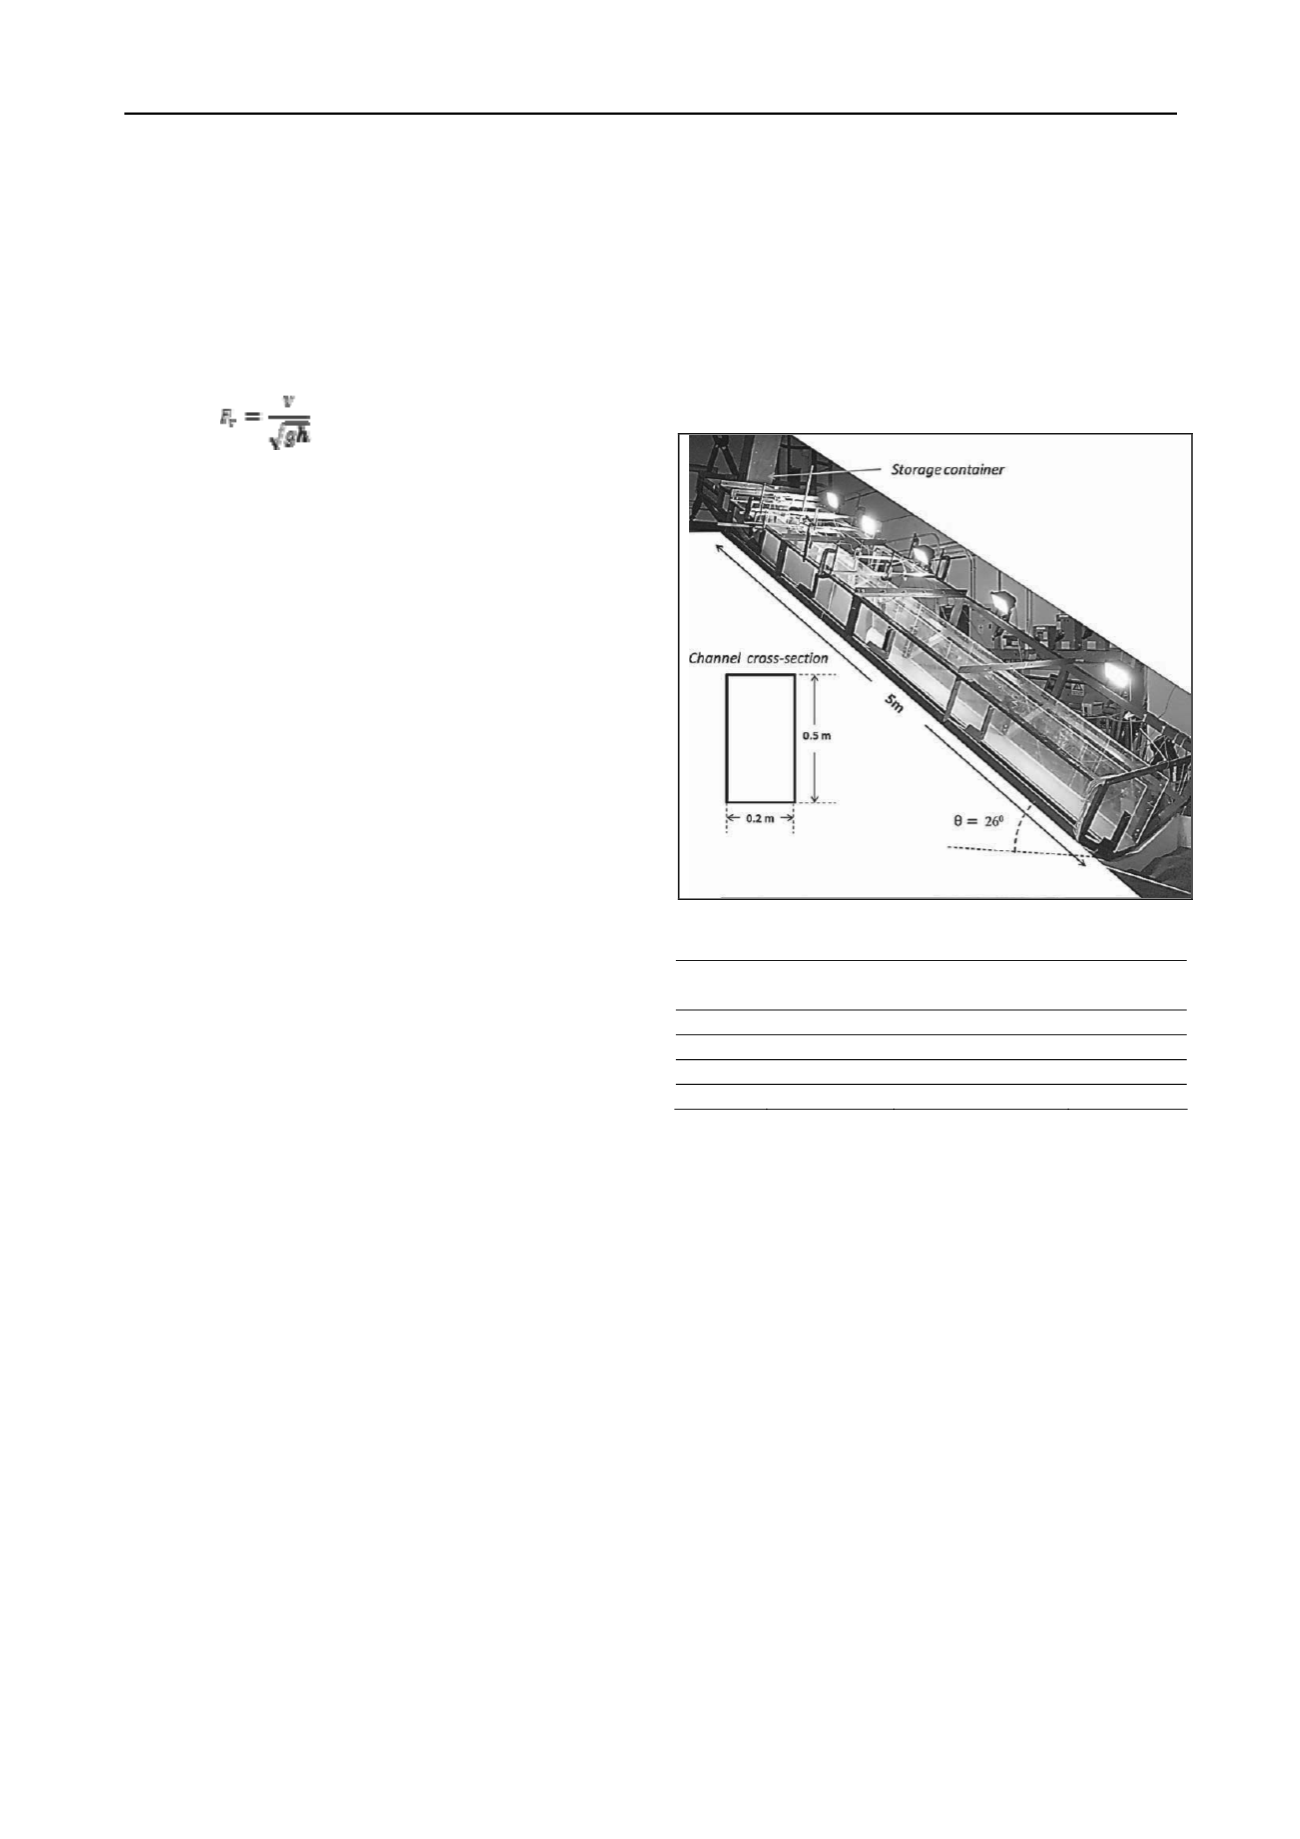
Kong University of Science and Technology (HKUST), a new
five metre long rectangular flume (see Figure 2) with a channel
base width of 0.2 m and height of side walls of 0.5 m was
developed for this study. Based on calibration exercises, an
inclination angle of 26
°
is used (Ng et al. 2012) to match an
F
r
≈ 3. Instrumentation and lighting are mounted on the external
frame surrounding the flume. Debris material is contained in a
storage container located at the most upstream end of the flume.
The storage container has a maximum storage volume of
0.08 m
3
and is equipped with a spring-loaded door secured by a
magnetic lock. At the most downstream end of the flume is a
deposition container for collecting debris materials.
2.3
Instrumentation
Ten photoconductive sensors are installed throughout the base
of the flume at intervals of 0.5 m. When debris passes over the
sensor, a signal is sent to the data logger at that particular
instant. With the known spacing and difference in time at
which signals are received between two sensors, the average
debris frontal velocity can be deduced along the entire
transportation zone. The uncertainty of photoconductive
sensors is estimated to be ± 0.05 m/s.
Laser sensors are mounted over the top of the channel to
capture centreline flow depths at specific locations along the
flume. Furthermore, high speed cameras are installed above
and at the side of the flume to capture the flow dynamics during
interaction with the array of baffles. The full resolution
capacity of the cameras is 1024 × 1024 pixels and with a
potential frequency of 759 frames per second.
3 TEST PROGRAMME
A series of four flume experiments are presented in this paper.
The details of experiments are given in Table 1. The four
experiments consist of one control experiment without baffles in
the channel to serve as reference and the three baffle
configurations which vary in number of staggered rows (one to
three rows). All experiments have been repeated to ensure
repeatability. For simplicity, a single baffle height of 0.75 times
the approach debris flow depth (
h
= 80 mm) is adopted for all
configurations. Details on the approach debris flow depth are
discussed by Ng et al. (2012). The degree of transverse
blockage is selected as 30% in this study. The degree of
transverse blockage is defined as the sum of obstruction in the
transverse direction divided by the width of the flume channel.
According to Ikeya and Uehara (1980) and Watanabe et al.
(1980), slit dams function primarily to retain flow material
through the mechanism of arching, while baffles primarily
impeded the flow mobility. Slit dams entail an equivalent
degree of transverse blockage of greater than 40%, therefore the
degree of transverse blockage selected in this study (i.e. 30%) is
appropriate for modelling debris flow baffles.
Figure 2. Flume model setup
Table 1. Test programme
Test ID
Baffle height
(h)
Transverse blockage
(%)
Number of
rows
H0_R1
0
0
0
H075_R1
0.75
h
30
1
H075_R2
0.75
h
30
2
H075_R3
0.75
h
30
3
h
: approach flow depth (80 mm)
The arrangement of full and half sized baffles used to create a
staggered formation as shown in Fig. 3. The dimensions of full
baffles are 20 mm × 20 mm × 60 mm, and the dimensions of
half baffles are 20 mm × 10 mm × 60 mm. The spacing
between successive rows is selected to be 50 mm or 0.25 times
the width of the flume channel. This spacing is selected based
on recommendations by Hakonardottir et al. (2001) that baffles
should be placed as close together as possible to promote the
deflection and interception of discharge from the slits of the
previous row.
4 EXPERIMENTAL RESULTS
5.1 Flow dynamics
As a flow front impacts an array of baffles, streams of debris
material discharge through the slits and part of debris also runs
up along the upstream vertical face of the baffles
simultaneously. The debris run up eventually exceeds the baffle
height and some materials become airborne. Synchronously,
material is deposited upstream of the baffles. The upstream
flow eventually rides over the deposited material and cascades
over the array of baffles. There are essentially two components
of downstream discharge, namely discharge through and
overtop of the baffles, both of which combine and propagate
downslope after the landing of overflow trajectory.


