2171
Technical Committee 208 /
Comité technique 208
al. 2004) and local inclinometer data (Quigley et al. 2010)
clearly illustrated slide activity in the years before the station’s
installation, the GPS monitoring did not. This was likely due to
a particularly dry period and the station was disassembled
before an adequate data set could be collected to observe long
term landslide behaviors.
5 RECENT INSAR TIME SERIES OBSERVATIONS
While the Permanent Scatterer InSAR method uses stable
coherent targets as shown in the examples above, it is also
limited by their presence. To increase the number of observed
scatterers and improve time series resolution, the new
proprietary algorithm (SqueeSAR™) developed by TRE
(Ferreti et al. 2011), utilizes both the Permanent and Distributed
Scatterer methods. Thus, a third InSAR time series analysis
was performed over the Berkeley Hills by Giannico et al. (2011)
applying the SqueeSAR
TM
method to TerraSAR-X data
acquisitions from 2009-2011.
As observed in the 1992-2007 InSAR time series analyses
(Hilley et al. 2004, Quigley et al. 2010), landslide related
displacements were clearly identifiable with velocities
averaging between 6 and 8 mm/year range-change and with
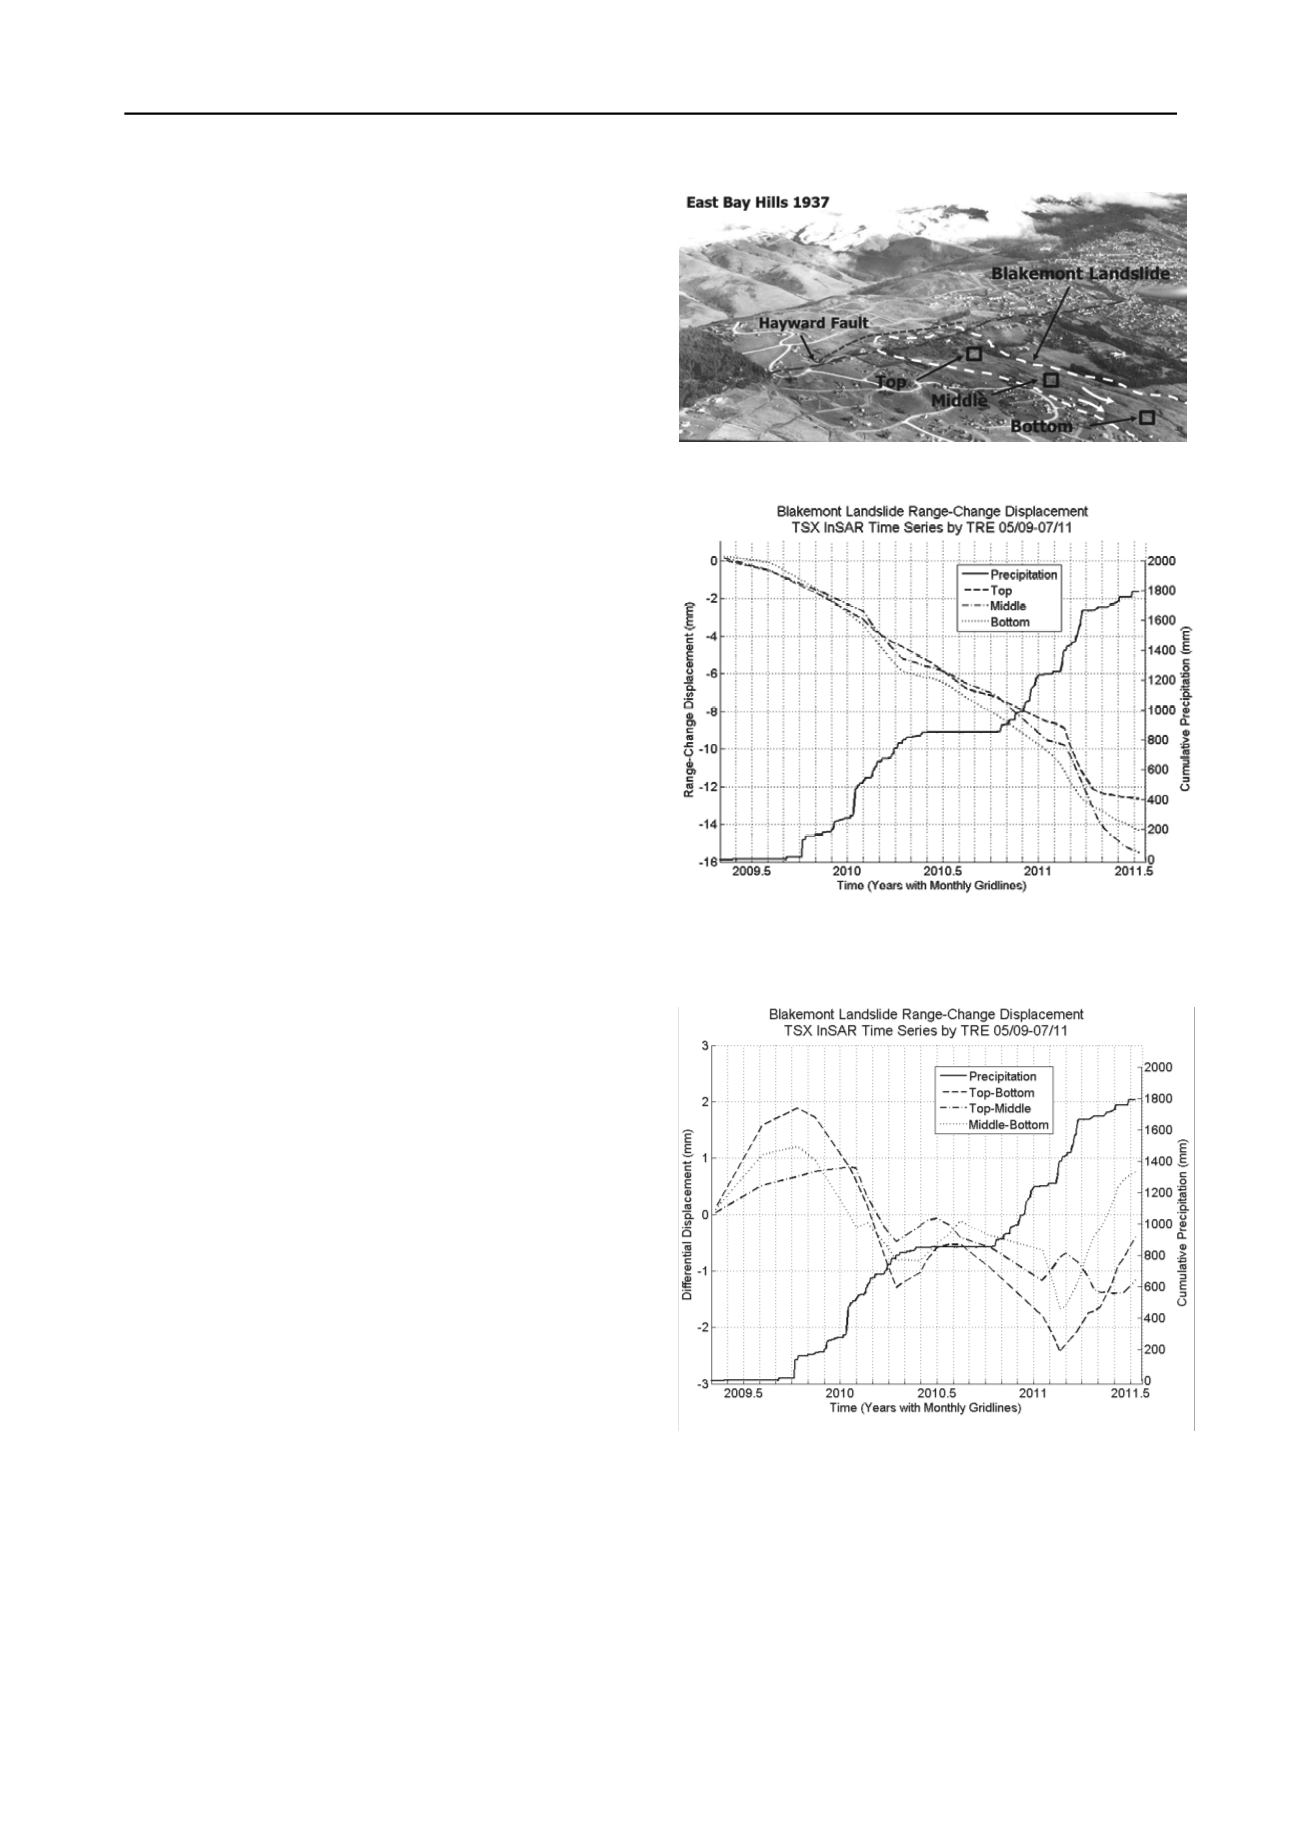
periods of precipitation-related acceleration. Figures 1 and 2
show the location and average displacement time histories for
different areas (top, middle and bottom) within the Blakemont
Landslide
(respectively),
plotted
against
cumulative
precipitation over the period of observation.
Located at the northern-most end of the study area, field
investigations have described the Blakemont Landslide as an
approximately 915-m-long, 215-m-wide translational soil and
rock landslide with nested rotational failures, and an active
sliding depth of 8 to 20 m (Alan Kropp and Associates 2002).
While the entire slide appears to be moving coherently
downslope (increasing range-change displacement from the
descending orbit acquisition), clear accelerations occur in early
2010 and early 2011, some 3 months after the onset of each wet
season. Furthermore, the landslide exhibits a positive
correlation between displacement and intensity of precipitation
with smooth variations during a more gradual 2009-2010 wet
season, in comparison to abrupt accelerations during a higher
intensity 2010-2011 season.
An important advantage of the higher spatial resolution
afforded by the TRE SqueeSAR
TM
method is a better
understanding of landslide mechanisms as expressed at the
ground surface. A closer look at the downslope displacements
of different areas within the Blakemont Landslide (Figure 2)
reveals that it is in fact not moving as one coherent mass, rather
with what physicists would call an “accordion effect”.
Differencing the average downslope displacements of each of
the highlighted areas from top to bottom of the landslide, a
pattern of apparent landslide shortening (positive) and extension
(negative) becomes evident (Figure 3). Here the largest
differential displacement variations are observed between the
top and bottom areas of the landslide. During wet seasons, the
difference in displacement between top and bottom of the
landslide increases as the lower portions of the slide accelerate
earlier than the upper portions. The same can be said for the
opposite case during dry periods, when the difference in
displacement between the top and bottom of the landslide
decreases as the lower portions of the landslide slow and the
upper portions catch up. Naturally, as this currently short
dataset is augmented, it is the authors’ hope to observe similar
trends over longer time periods.
Figure 1. 1937 Oblique view of Blakemont landslide showing location
of approximate highlighted areas in TerraSAR-X InSAR study.
Figure 2. TRE SqueeSAR
TM
analysis of TerraSAR-X data acquisitions
(2009-2011), illustrating average downslope (negative) range-change
displacement (left axis) in top, middle and bottom areas of Blakemont
Landslide versus cumulative precipitation (right axis).
Figure 3. Differential of average downslope displacements (left axis)
from TRE SqueeSAR
TM
analysis of TerraSAR-X acquisitions (2009-
2011) between highlighted areas of the Blakemont Landslide, from top
to bottom, plotted against cumulative precipitation (right axis).
6 PRELIMINARY GPS RESULTS
Daily solutions from the first 6 continuously streaming GPS
stations have been recorded since their installation in January
2012. Highlighted here are stations “LRA 1-3” located on the
same landslide in Chicken Canyon at LBNL, as depicted in the
1935 air photo (Figure 4). While historical ground surface
displacement related to this landslide has yet to be characterized
and quantified, extensive field investigations have described it


