995
Technical Committee 105 /
Comité technique 105
particle size, and mean stress – which is of course possible, yet
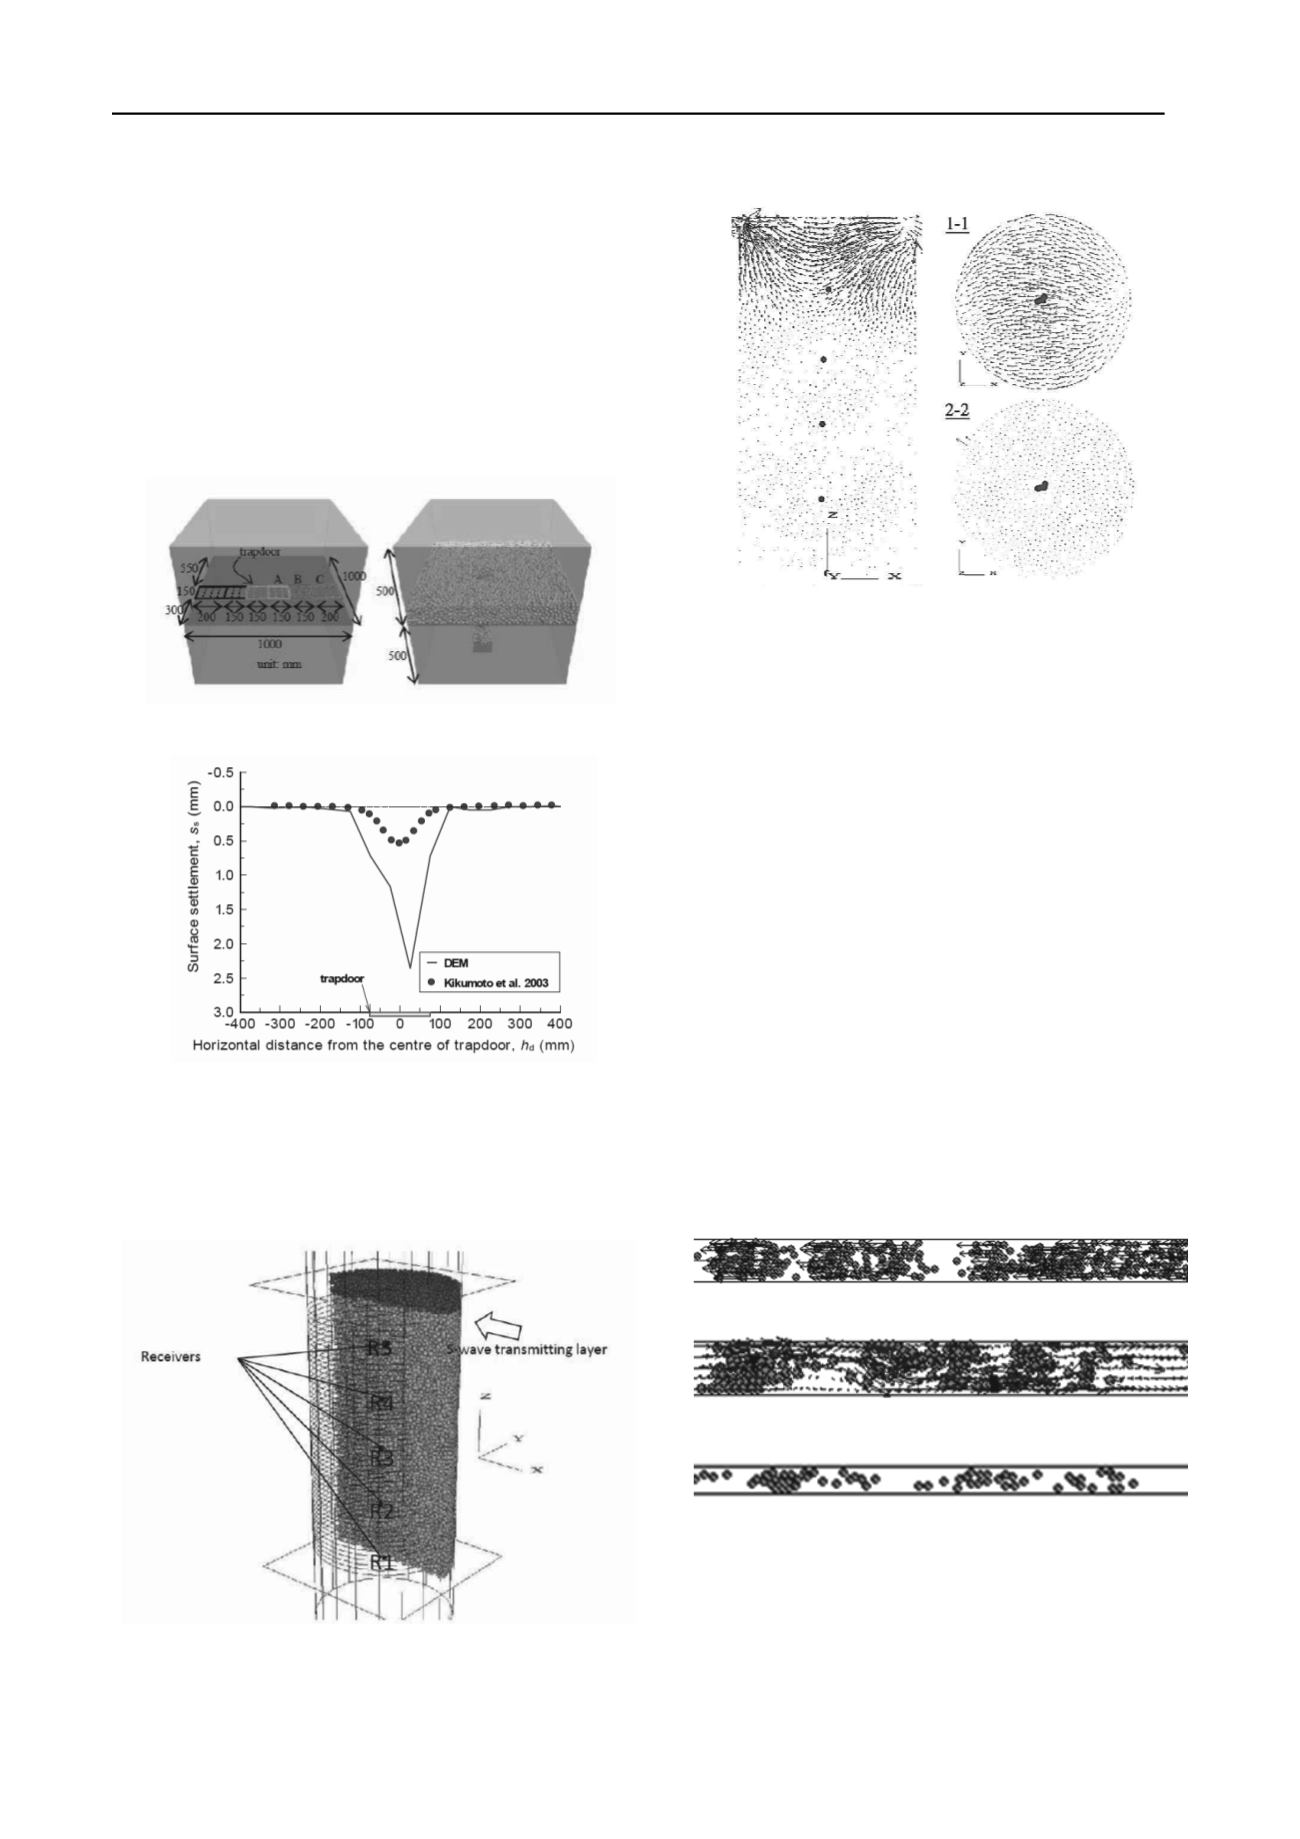
difficult, with laboratory experiments. Cylindrical assemblies of
particles are subjected to shear wave excitation at one end and
axial propagation velocities are measured (see Fig. 10).
Micromechanical observations of the specimen are presented
and analyzed in terms of particle velocity vectors, which
highlight the complex motions of individual particles during
wave propagation. As an example, velocity vectors in Fig. 11
show dominant S-wave motion (from right to left) in the central
area of the specimen, while minor P-wave motion is observed
on the sides (with the particle on the right moving downwards
and the particle on the left moving upwards).
(a)
(b)
Figure 9. (a) Trap door and gravity flow testing apparatus (left), and
DEM simulation (right); (b) Surface settlement of the sand above the
center of the trapdoor when dt = 2.0 mm, layer thickness 150 mm
(Kikkawa et al. 2013).
.
Figure 10. DEM specimen with S-wave transmitting layer and
receivers – for clarity, only half of the specimen is shown (
Ning &
Evans 2013
).
Figure 11. Particle velocity vectors on different cutting planes of a
DEM specimen at a 10ms time point after excitation (
Ning & Evans
2013
).
The paper by
Tomac & Gutierrez (2013)
also uses DEM as a
tool for understanding processes, the focus of this nice study
being the flow of dense sand slurries within a narrow channel –
where “dense” means that the volumetric particle concentration
is greater than 10%, and “narrow” that the width of the channel
is less than 5 times the particle diameter. In these flow
processes, clogging and velocity retardation often occur and are
governed by sand concentration and slurry flow rate. The
numerical model developed by the Authors couples the Discrete
Element Method with computational fluid dynamics to study (in
2D) this flow process. A user-defined contact model is
developed to capture the non-linear collision of submerged
particles and walls. The theory of lubrication is also used to
formulate a damping effect which is associated with the model.
Some key results of this study are shown in Fig. 12. Maximum
sand concentration (
i.e
., the concentration at which sand
transport is not possible and the flow stops) is shown to depend
on the ratio of channel width to particle diameter, as well as – to
a lesser extent – on fluid pressure. Since solid and fluid phases
have different average velocities, it is hard to average and come
up with a unique slurry flow characterization at this point; the
Authors conclude that a more comprehensive study is needed to
address this issue.
Figure 12. (top) Clogging of sand in 4mm wide channel at initial
volumetric sand concentration c
v
= 0.49 with particles velocities
vectors in direction opposite to the flow; (middle) Unstable flow with
formation of particles packs at initial c
v
= 0.39 in 4mm wide channel
with fluid flow velocity vectors around packs; (bottom) Formation of
particles packs at initial c
v
= 0.28 in 2mm wide channel (
Tomac &
Gutierrez 2013
).


