993
Technical Committee 105 /
Comité technique 105
3 PAPERS PRESENTED TO THIS SESSION
3.1
Looking inside a soil sample using x-ray tomography
X-ray computed tomography (CT) is now widely used in
material sciences and has amply proved its interest in
geomechanics (see Viggiani & Hall 2012 for an overview). The
principle of CT measurement consists of recording x-ray
radiographs of a specimen at many different angular positions
around the object. From these different projections, a three
dimensional image of the object can be reconstructed with
appropriate algorithms. X-ray CT is therefore a non-destructive
imaging technique that allows quantification of internal features
of a soil (or rock) sample in 3D.
Otani et al. (2013)
used x-ray CT for imaging a sandy soil at
different levels of compaction in 1D conditions. The motivation
for this experimental study is to check whether the current
criteria for quality control of dynamic compaction of soil for
riverbanks are appropriate or not. Two cases were investigated,
corresponding to a different number of blows to yield the same
total compacting energy (cases 1 and 2 in Fig. 1, corresponding
to higher and lower individual blow energy, respectively).
Quantitative analysis of the 3D images from x-ray tomography
allows Otani and coworkers to obtain the distribution of
porosity in the sample and to follow its evolution with
increasing compaction – see Fig. 1.
Figure 1. Spatial distribution of porosity in two samples of silty sand at
different levels of compaction, as obtained with x-ray CT (
Otani et al.
2013
).
A second experimental study using x-ray tomography is
presented by
Andò et al. (2013)
. Further details and results can
be found in Andò
et al.
(2012a, 2012b). The motivation for this
study comes from the fact that strain localization presents major
challenges for continuum models for geomaterials. For such
models to be successful, the microstructure of the material (for
sand, at the grain scale) should be explicitly taken into account,
in one way or another, which in turn requires experimental
characterization of shear banding at the grain scale.
Andò et al.
(2013)
used x-ray tomography to image samples of two
different sands (see Fig. 2) while they deform under triaxial
compression.
Figure 2. Slices from x-ray images of angular Hostun sand (left) and
rounded Caicos ooids (right) tested by
Andò et al. (2013
).
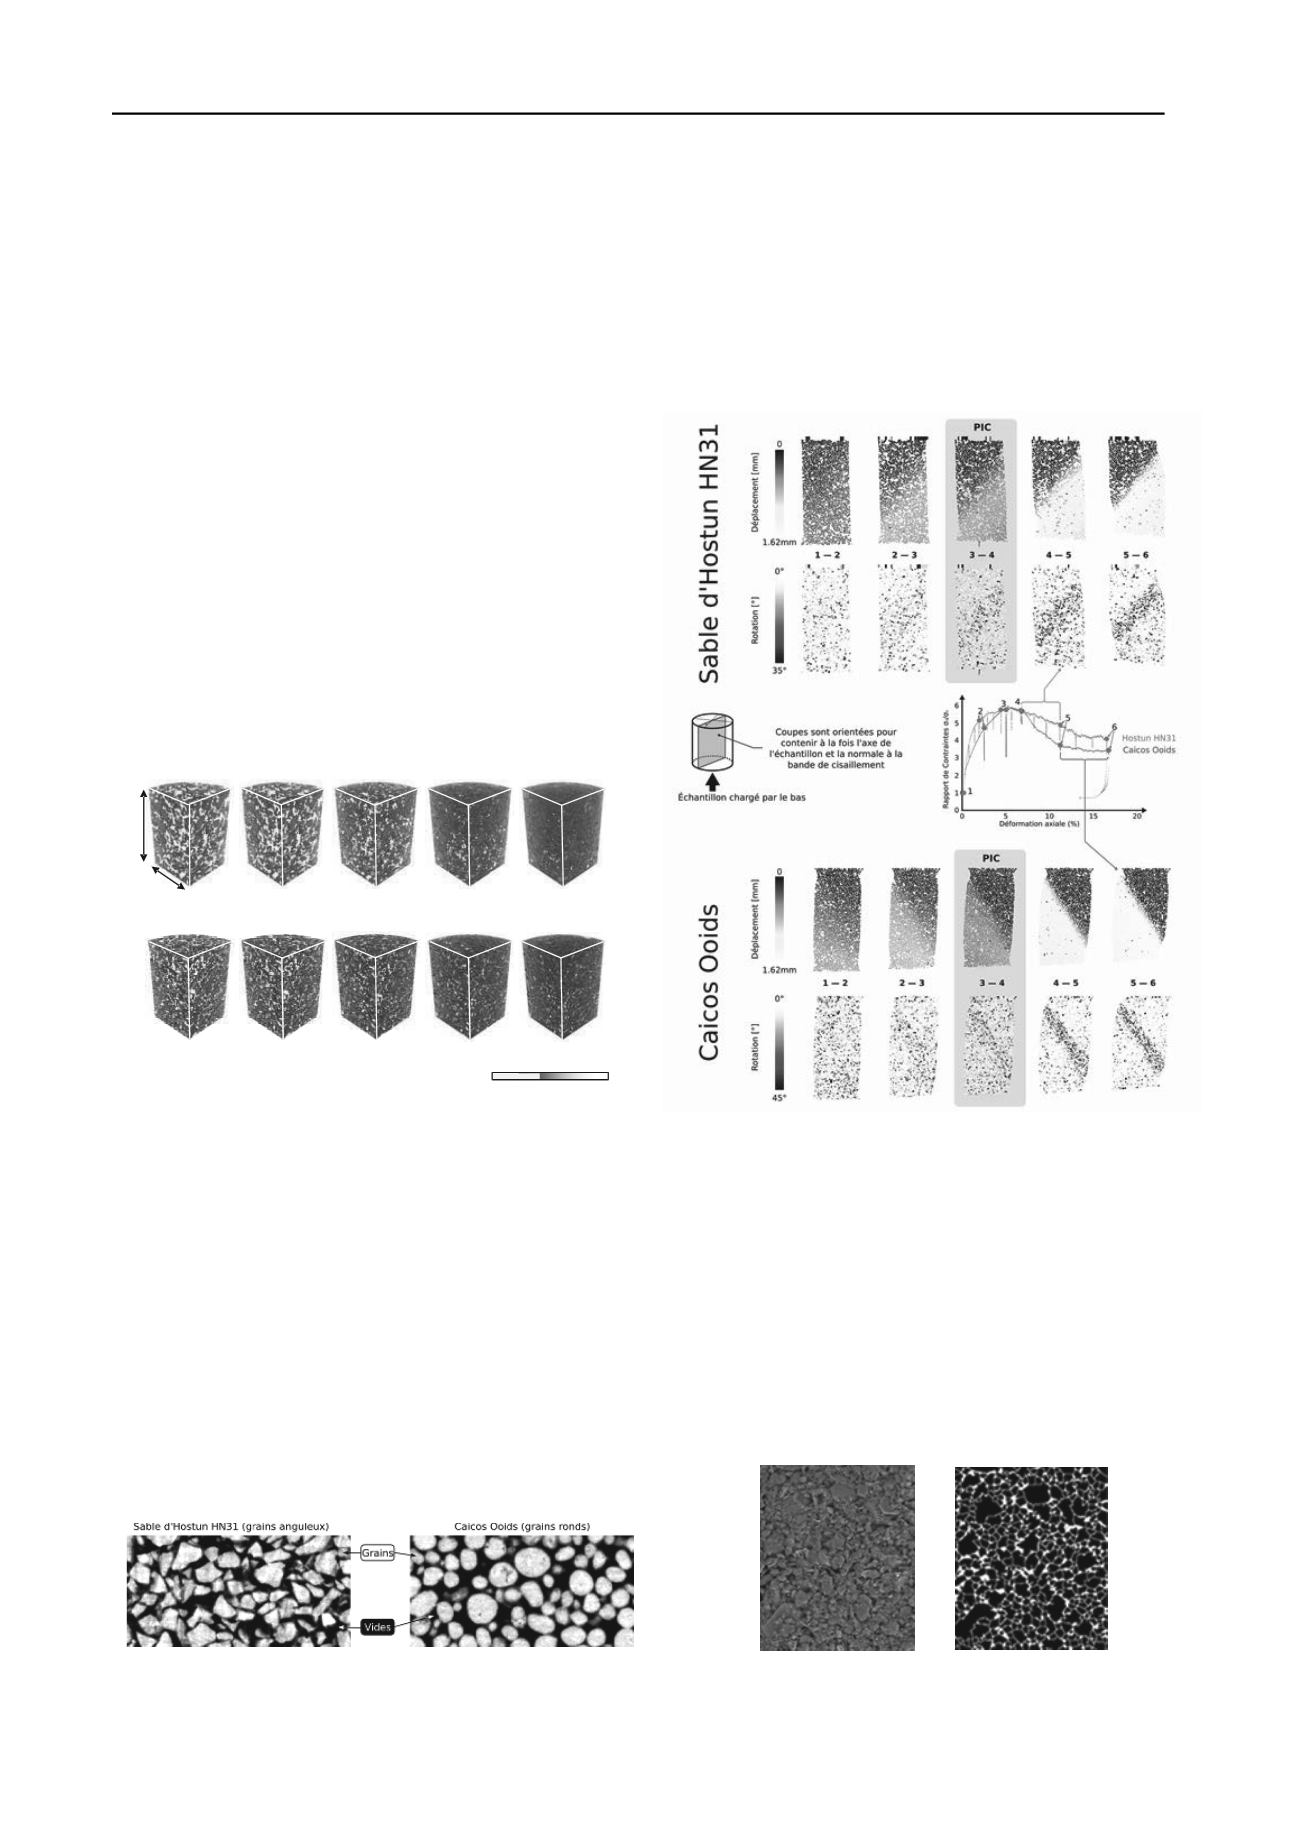
The results of this study clearly show that thanks to x-ray
tomography, combined with either 3D Digital Image
Correlation or Particle Tracking, the evolution of the 3D
microstructure of a small sample of sand can be followed while
it deforms, individual grains can be distinguished in the time-
lapse 3D images, and analyzed to give the full 3D kinematics
(displacement + rotation) of each individual grain in the sample
(see as an example Fig. 3). Analysis of deformation at this scale
is, in the Authors’ own words, a dream that has come through!
0
80
24
CT-value
initial
Level A
Level C
Level E
Level G
0
40mm
25mm
(a) Case-1
(b) Case-2
initial
Level A
Level C
Level E
Level G
Figure 3. Slices showing grains of a triaxial test on Hostun sand (top)
and Caicos ooids (bottom) at 100 kPa confinement, colored by their
vertical displacement and intensity of 3D rotation. The increments
studied are highlighted on the stress-ratio
vs.
axial shortening in the
middle of the figure (
Andò et al. 2013
).
3.2
Fine-grained soils from micro to macro
Yigit et al. (2013)
present a contribution investigating the time
dependent behavior of clays. In this experimental study, ESEM
micrographs of kaolinite clay are taken under different levels of
load in oedometric compression, and after different amounts of
creep time. The pixel size in the micrographs was 8.47
10
-2
m,
which is small enough to see the macro voids (see Fig. 4).
Figure 4. Raw (left) and segmented (right) ESEM micrographs of
kaolinite clay (
Yigit & Cinicioglu 2013
).


