705
Technical Committee 103 /
Comité technique 103
According to Figure 1, the Cosserat rotations have their
significant values in the shear band located at the middle of
layer, while outside the shear band, the values are nearly zero.
These results are in accordance with the experimental
observations (Hall et al. 2010). The maximum values of
Cosserat rotation occurs where shear strain localization may be
developed under continuous shearing. The thickness of shear
band can be detected with respect to the distribution of Cosserat
rotation based on its high values. This indicates that micro-polar
effects in granular materials are significant when shear
localization appears as also detected in experiments (Hall et al.
2010).
0
5
10
15
20
25
30
35
40
0.0 0.3 0.6 0.9 1.2 1.5 1.8 2.1
Cosserat rotation,
c
3
(Rad)
X
2
/d
50
U1B/h0=4.500
U1B/h0=2.500
U1B/h0=1.000
U1B/h0=0.500
U1B/h0=0.125
Figure 1. Distribution of Cosserat rotation across normalized height of
granular layer under
P
0
= 100
kPa
for different
U
1B
/
h
0
(
e
0
= 0.6,
d
50
= 1
mm
).
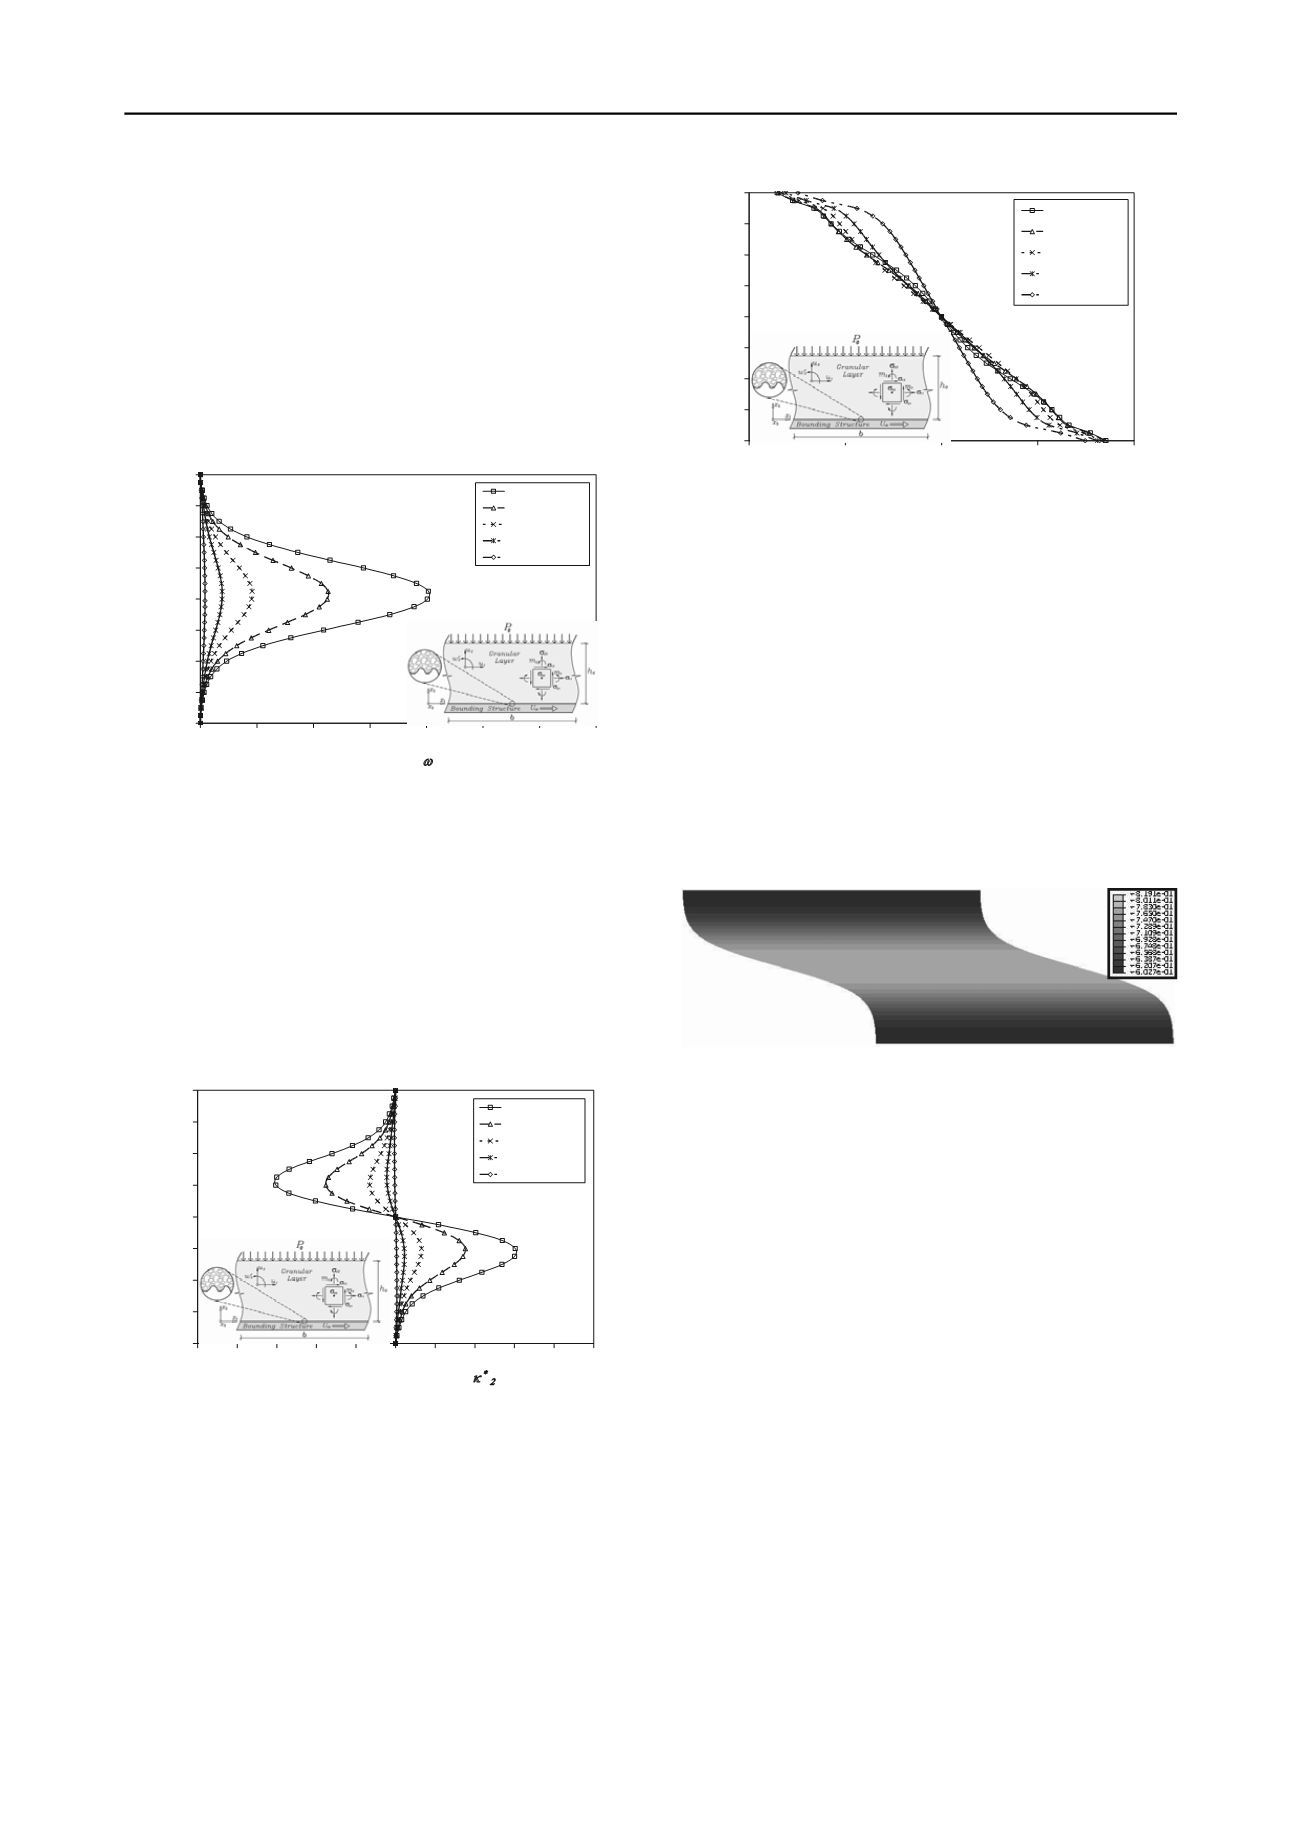
The normalized micro-curvature (
2
), distributed across
normalized layer height, is presented in Figure 2. Based on this
figure, the values of
2
are high in the shear band. This result is
in agreement with the numerical calculations which use discrete
element method (Oda and Iwashita 2000). In parts where the
normalized micro-curvatures (
2
) are nearly zero, the material
behaves as a rigid body. The sign of normalized micro-
curvature (
2
) is sharply switched at the middle of shear band,
shown in Figure 2.
*
*
*
*
0
5
10
15
20
25
30
35
40
-1.0 -0.8 -0.6 -0.4 -0.2 0.0 0.2 0.4 0.6 0.8 1.0
Normalized micro-curvature,
X
2
/d
50
U1B/h0=4.500
U1B/h0=2.500
U1B/h0=1.000
U1B/h0=0.500
U1B/h0=0.125
Figure 2. Distribution of normalized micro-curvature across normalized
height of granular layer under
P
0
= 100
kPa
for different
U
1B
/
h
0
(
e
0
=
0.6,
d
50
= 1
mm
).
Figure 3 illustrates the non-uniform distribution of
normalized couple stresses ( ) across the normalized height of
granular layer. As displayed in this figure, the distribution of
is critically non-linear where the horizontal displacement of
bounding structure increases. The variation of
depends
significantly on the values of horizontal displacement applied to
the bounding structure. Although, couple stress within the shear
band cannot be measured experimentally due to its small
magnitude, it can be detected by soil grain rotation which is
visible in the experiments (Hall et al. 2010) and DEM
simulations (Oda and Iwashita 2000).
*
2
m
*
2
m
*
2
m
0
5
10
15
20
25
30
35
40
-0.0010
-0.0005
0.0000
0.0005
0.0010
Normalized couple stress, m*
2
X
2
/d
50
U1B/h0=4.500
U1B/h0=2.500
U1B/h0=1.000
U1B/h0=0.500
U1B/h0=0.125
Figure 3. Distribution of normalized couple stress across normalized
height of granular layer under
P
0
= 100
kPa
for different
U
1B
/
h
0
(
e
0
=
0.6,
d
50
= 1
mm
).
According to the Figures 1-3, micro-polar quantities are
noticeable within the shear band during plane shearing. The
shear band is characterized by significant Cosserat rotations and
pronounced micro-curvatures. High quantities of couple stresses
are obtained at the shear band edges. The contour plot of void
ratio and deformed configuration of granular layer in the
residual state for an initially homogeneous void ratio of
e
0
= 0.6
after horizontal displacement of
u
1B
= 1.50
h
0
are presented in
Figure 4. The brighter zones, in the plot, are of higher void
ratios as a result of dilatancy or where failure may start. Based
on this figure, the deformation of large shearing are obviously
concentrated within a narrow band at the middle of the layer.
The predicted thickness of shear band is about 23
d
50
.
Figure 4. Deformed configuration of granular layer under
P
0
= 100
kPa
after
U
1B
= 1.5
h
0
along with contour plot of void ratio (
e
0
= 0.6,
d
50
= 1
mm
)
Herein, the shear band formation is investigated in a biaxial
compression test. For numerical modeling, a dry granular
cuboid with a height
h
0
= 20
cm
, a width
b
= 8
cm
and a unit
depth is considered. The specimen is laterally conned by an
external pressure of 70
kPa
and kept between two opposing
horizontal plates. In nite element calculations, initial
homogeneous state is assumed with initial void ratio, (
e
0
=
0.6)
and mean grain diameter, (
d
50
= 1
mm
). Afterwards, the axial
quasi-static deformation in granular material is initiated through
a constant vertical displacement increment prescribed to the top
plate. Finite element simulations of biaxial compression test are
carried out for three different element sizes. The finite element
meshes consist of 640, 2560 and 10240 elements. The deformed
meshes along with contour plots of void ratio at vertical
compression of
u
2
/
h
0
= 10% are presented in Figure 5. The
complete shear band is already emerged shortly after the peak
state. This result coincides with the solution of a bifurcation
analysis (Vardoulakis 1980). Shear band is characterized by an
increase of void ratio (Figure 5). This result confirms the
experimental findings by Desrues et al. (1996). The width of
shear band has an almost constant value of 14
d
50
for all mesh
sizes. The inclination of shear band with respect to the
horizontal axis has a nearly constant value of 55. Both the
thickness and inclination of shear band are in satisfying
agreement with the experimental results (Alshibli and Sture
2000).


