497
Technical Committee 102 /
Comité technique 102
Figure 3.
From this figure it clearly appears that higher strength was
provided by the tests carried out on the SWGS, for which UCS
has been found to range between 12 and 16 MPa at 40 curing
days.
UCS obtained from the LS is lower at any curing time
investigated. In particular the UCS was found to be about 7.0
MPa at 40 curing days.
From the same figure, it also appears that UCS of LWGS
approaches the field values.
These results underlines the effectiveness of the
experimental set up in simulating the real field conditions, and
emphasizes the significant effect of drainage conditions, which
increase the UCS of about 1,9 times at 40 curing day.
To evaluate the influence of the type of sand, and, therefore,
of the related drainage effect on strength properties, the same
experimental procedure for sample preparation was replicated
on Serapo sand.
The results of Figure 4 confirm also for this kind of sand an
increment, even though less significant, of the UCS due to the
drainage effect. The increment was about 40% at 40 curing days
for the LWGS specimens with respect to the classical LS.
It is important to note (Figure 4) that similar UCS at 40
curing days was obtained from the LS of both Zandvoort and
Serapo sands (prepared according to JGS0821-2000). This was
expected since the two sands presents similar grain size
distributions.
The results obtained from the newly developed experimental
apparatus show that the type of sand and the corresponding
water drainage effect may greatly influence the mechanical
properties of the stabilized sandy soils.
0
5
10
15
20
25
0
25
50
75
100
125
15
Unconfined compressive strength, UCS (Mpa)
Curing time, t
cur
(days)
To investigate in more details the reason of this particular
outcome, mineralogical and microstructural tests were
performed on the two types of sand.
The SEM and EDS analyses results are shown in Figure 5
and 6.
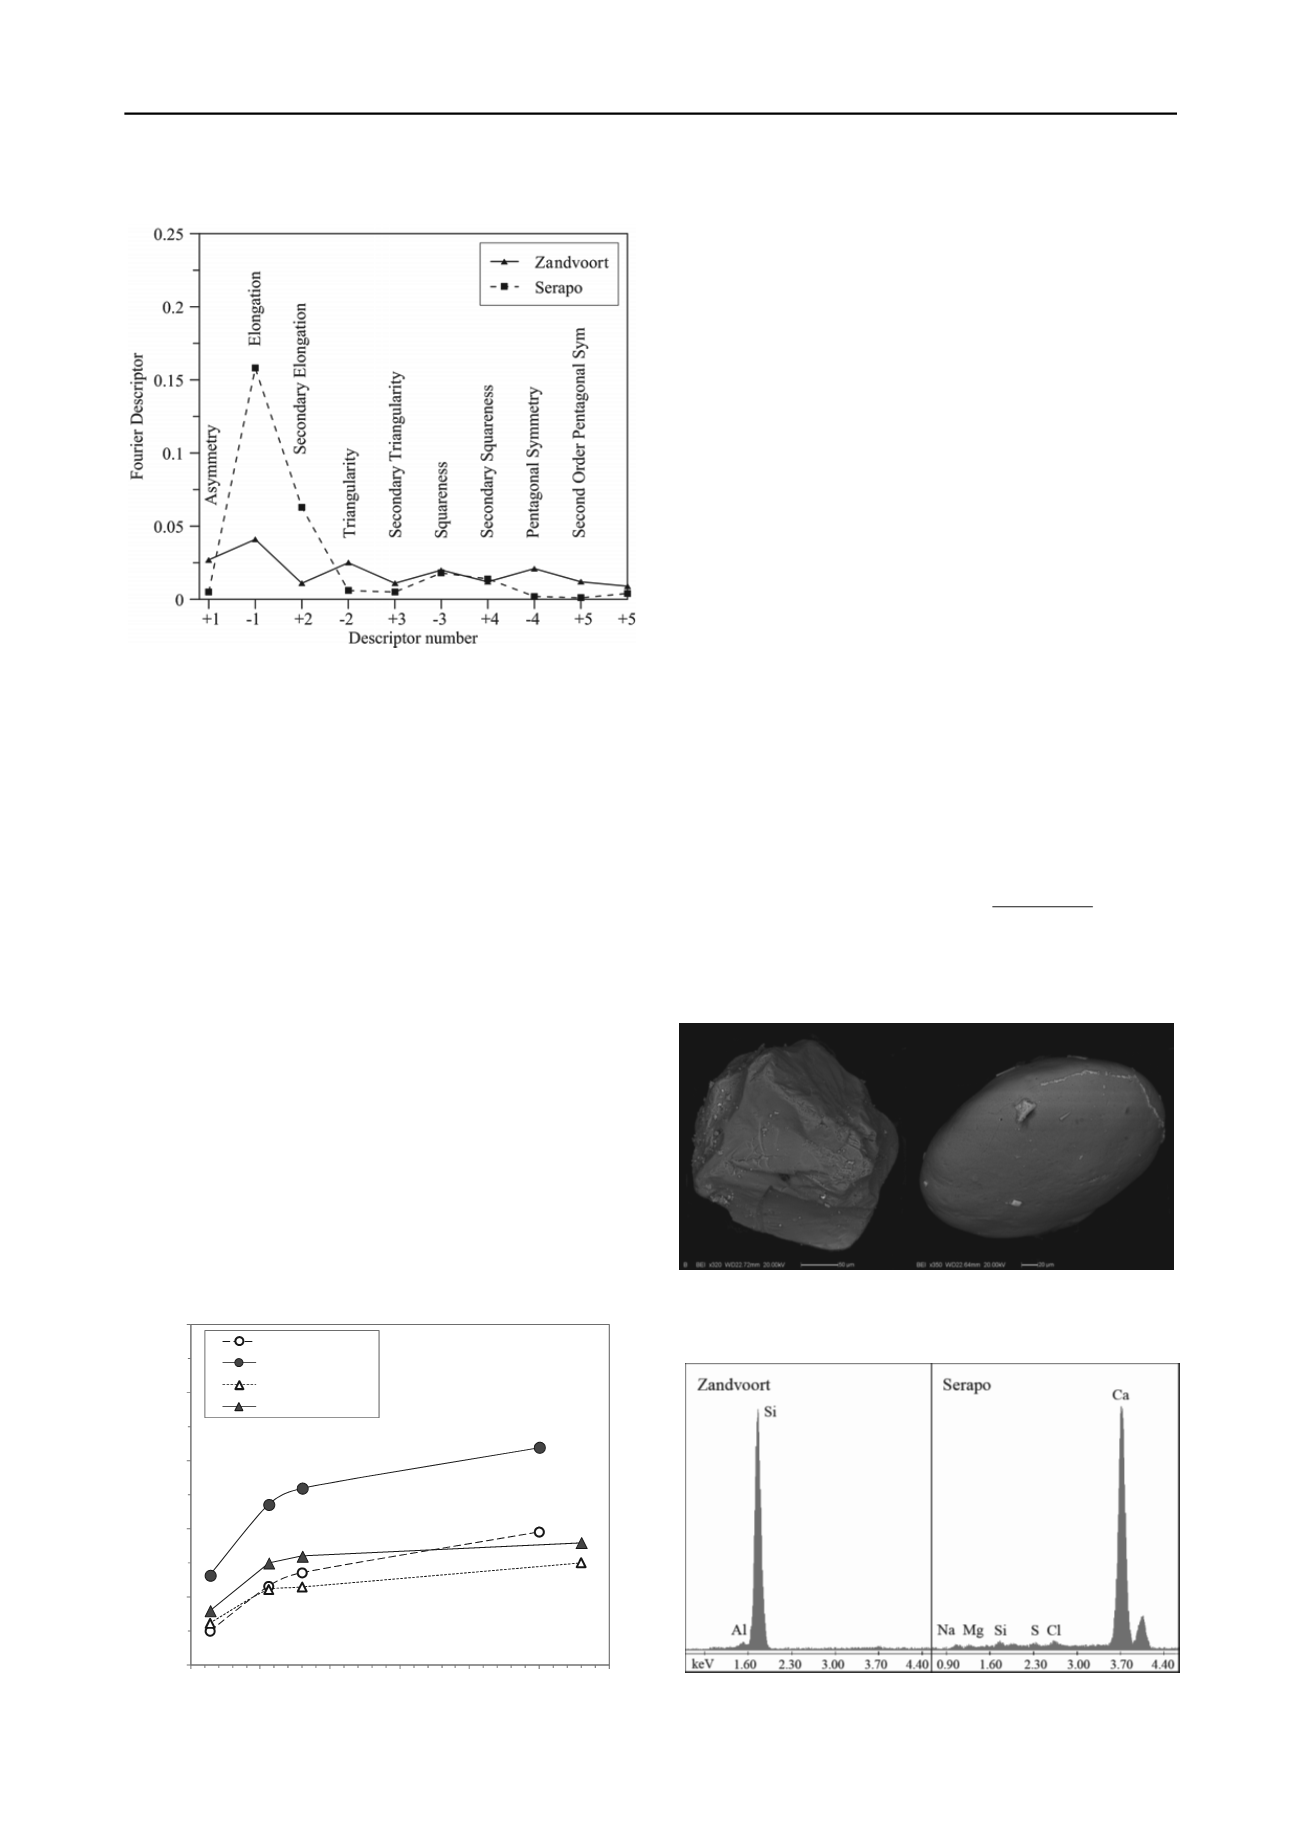
Figure 5 presents two backscattered electron (BE) images of
two different sand grains: the grain on the left referring to
Zandvoort
sand, whereas that on the right to Serapo
sand.
Generally, both sands are predominantly composed of quartz
minerals, but in the Serapo sand a significant portion of
carbonate particles is present (Figure 6).
In addition, it is easily detectable the more irregular and
angular morphology of quartz grains of Zandvoort sand with
respect to the more rounded, sub-angular carbonate grain of
Serapo sand.
To quantify the degree of angularity different methods have
been proposed in the literature (de Santiago et al., 2008).
Among them, the procedure based on the Fourier descriptors
(Bowman et al, 2001) is one of the most diffuse recent
approaches.
0
SWGS Zandvoort
LS Zandvoort
LWGS Zandvoort
Figure 3. UC test results on Zandvoort sand specimens
i r 7. Lower order Fourier Descriptors obtained from the two
types of sands.
The boundary of the particle is circumnavigated in the
complex plane at a constant speed. The step size is selected so
that the circumnavigation takes 2π and the number of steps is
2
k
. The complex function presented in Eq. (1) allows to
determine the aforementioned Fourier descriptors
2/
12/
2
exp
N
N n
n
m m
M
mn i
Z
yi
x
(1)
where
x
,
y
are the coordinates of the particle boundary,
N
is the
Figure 5.
Comparison between SE images of a Zandvoort (on the left)
and Serapo sand grain (on the right)
Figure 6.
Chemical compositions from EDS analysis performed on a
Zandvoort (on the left) and a Serapo sand grains (on the right).
0
5
10
15
20
25
0
25
50
75
100
125
15
Unconfined compressive strength, UCS (Mpa)
Curing time, t
cur
(days)
0
LS Zandvoort
LWGS Zandvoort
LS Serapo
LWGS Serapo
Figure 4. UC test results on Zandvoort and Serapo specimens


