505
Technical Committee 102 /
Comité technique 102
Proceedings of the 18
th
International Conference on Soil Mechanics and Geotechnical Engineering, Paris 2013
structural beam elements. The analysis modelled a half width of
the excavation where the right-hand boundary of the mesh
represented the line of symmetry at the centre line of
excavation. The finite mesh was 140 m long and 84 m deep.
The half width of the excavation was 20m. The bottom
boundary was strained from both vertical and horizontal
movements. The left-hand and right-hand boundaries were free
to move in the vertical direction.
The soil and bedrock profiles used in the analysis were
based on borehole logs. The groundwater level was taken at 5 m
below existing ground surface at the initial stage. During the
excavation, the groundwater level was assumed to be drawn
down to the excavation level at the excavated side.
For the surface sandy fill, the Young’s modulus E of 25 MPa
and the friction angle
of 30
o
were assumed. For the clayey
soils, the undrained shear strength s
u
was estimated from 6N,
where N is the blow counts of the standard penetration testing.
The residual s
u
was taken as 50% of the initial s
u
. The undrained
E of clayey soil was estimated from 1500s
u
for the native low
plasticity clayey silt till and 500s
u
for the clayey silt fill,
respectively. The soil Poisson’s ratio was taken as 0.3. The unit
weight
was obtained from available laboratory testing data.
Mohr Coulomb failure criterion was used for soils. The soil
properties used in the analysis are shown in Table 1.
Table 1. Soil parameters used in the finite element analysis
Depth
(m)
Type
(kN/m
3
)
E
(MPa)
s
u
(kPa)
K
o
0 – 1
Sandy
fill
20
25
0
30
0.5
1 –
4.5
Clayey
fill
20
30
60
-
0.75
4.5 –
9.3
Clayey
till
21
225 150
-
0.75
0
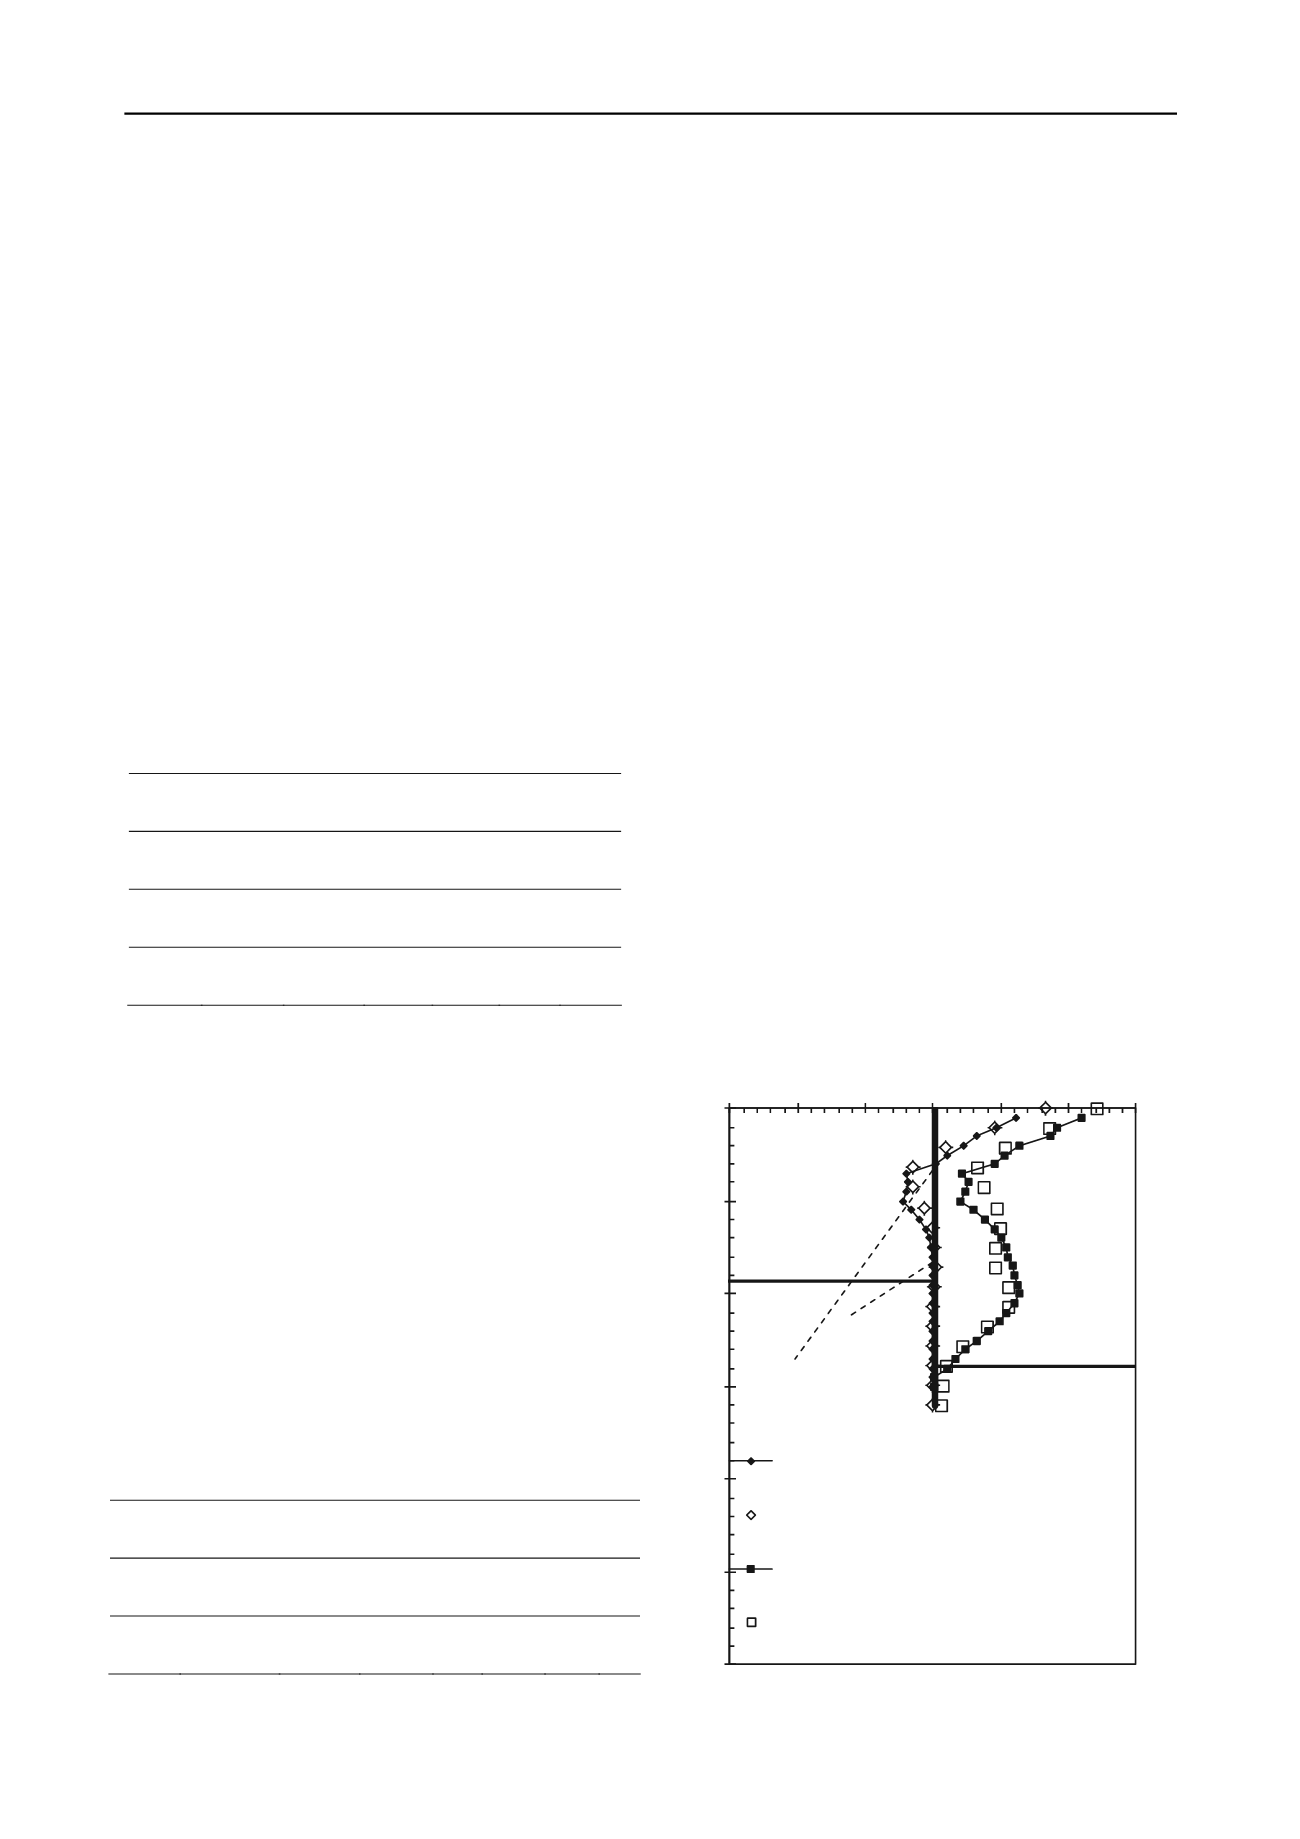
5
10
15
20
25
30
-15 -10
-5
0
5
10
15
Depth (m)
Lateral Deflection (mm)
Inclinometer readings after upper tieback installed
Computered deflections after upper tieback installed
Inclinometer readings after excavation to bottom
Computered deflections after excavation to bottom
ExcavationLevel
Bedrock Surface
Note: K
o
is the coefficient of lateral earth pressure (total stress)
For the jointed shaly bedrock, the generalized Hoek-Brown
constitutive model was used. The following parameters were
used to generate the generalized Hoek-Brown rock-mass
strength criterion: (1) The geological strength index was taken
as 60 for sound bedrock, respecting blocky to very blocky, good
to fair joint surface, and 30 for weathered bedrock, respecting
blocky/disturbed/seamy joint surface; (2) The intact rock
constant was taken as 8 for sound bedrock (highest value for
shale) and 4 for weather bedrock (lowest value for shale); (3)
The disturbance factor was taken as 0 for excellent quality
controlled excavation; and (4) The modulus ratio was taken as
250 for bedrock (highest value for shale) and 150 for weather
bedrock (lowest value for shale). The intact compressive
strength was obtained from available results of rock point load
testing and unconfined compressive testing. The rock Poisson’s
ratio was taken as 0.15. Based on the above assumptions, the
obtained strength parameters for the generalized Hoek-Brown’s
model are summarized in Table 2.
Table 2. Rock parameters used in the finite element analysis
Depth
(m)
Type
(kN/m
3
)
E
(MPa)
m
b
s
a K
o
9.3 –
11.3
Weathered
bedrock
25
244 0.3 0.004 0.52
2
>11.3
Sound
bedrock
26
3072 1.3 0.004 0.51
4
Note: m
b
, s and a are parameters used in generalized Hoek-Brown’s
model
The soldier pile wall was modelled as reinforced concrete
with W610x82 at spacing of 3.05 m. The equivalent thickness
of 0.4 MPa concrete was taken as 0.2 m and the Young’s
modulus was 2.8 GPa. The concrete compressive and tensile
strengths were taken as 400 kPa and 40 kPa, respectively. The
compressive and tensile strengths of W610x82 were taken as
345 MPa. The Poisson’s ratio for steel and concrete was taken
as 0.2. The equivalent bolt diameters for the upper and lower
tiebacks were taken as 32 mm and 24.5 mm, respectively. The
Young’s modulus of tiebacks was taken as 200 GPa. The bond
shear stiffness was taken as 6000 kN/m/m based on the tieback
proof test results. The bond lengths of the upper and lower
tiebacks were taken as 5 m and 3 m, respectively. The spacing
of tiebacks was taken as 3.05m.
The measured and computed wall deflections after the
installation of upper tiebacks and the excavation just to the
bottom are shown in Figure 4. The computed wall deflections
are in a good agreement with the inclinometer measurements,
indicating that the in-put parameters used in the analysis are
reasonable.
The computed bending moments for the excavation just to
bottom are compared with those deduced from the inclinometer
measurements as shown in Figure 5. The bending moments
deduced from the inclinometer measurements are comparable
with the computed except near the ground surface where
significant high values deduced from the inclinometer
measurements. Ignoring the high bending moments near the
ground surface, the bending moments deduced from the
inclinometer measurements can be used for the checking of the
capacity of the soldier piles.
The inclinometer measurements show that up to 7 mm lateral
movement was developed after the excavation to bottom as
shown in Figure 2. This could be due to three possible reasons:
(1) the consolidation of clayey soil; (2) de-stressing of tiebacks;
and (3) time-dependent deformation of the shaly rock upon
relief of the initial high horizontal stresses. The first two
possible reasons have been studied in the finite element analysis
using the effective parameters and reduced modulus for the
Figure 4. Measured and computed wall deflections


