508
Proceedings of the 18
th
International Conference on Soil Mechanics and Geotechnical Engineering, Paris 2013
methods, quality of sample and quality of laboratory tests. All
borehole samples in sandy aquifers are of class-3 or class-4
quality. For information, the class-4 quality is obtained with the
hollow stem auger, rotary, percussion, cable tool and sonic
drilling methods (Baldwin and Gosling 2009). These methods
strongly influence not only the quality of samples, but also the
quality of permeability tests, and the quality of the MW
installation (Chapuis and Sabourin 1989; Chesnaux et al. 2006;
Chesnaux and Chapuis 2007). In sandy aquifers, a tube sampler
with a clear plastic liner can be used. This tool does not provide
class-1 or -2 samples. It roughly preserves the grain size
distribution curve (GSDC), with major margin disturbance
(thick-walled sampling) plus some mixing between adjacent
sub-layers. It does not preserve the water content
w
, void ratio
e
,
and
K
in situ values. For that reason, this sampler provides
class-4 samples, and not intact ones as claimed in a few papers.
Several methods can be used to predict the
K
value of a soil
sample. Chapuis (2012a) listed 45 methods and assessed their
capacity against large data sets for laboratory permeability tests
performed on homogenized fully saturated specimens. All tests
were not plagued by one of the 14 most frequent mistakes when
performing such tests. For sandy aquifers, the in situ porosity
n
can be assessed using the method of Chapuis (2012b) and the
K
values can be predicted with the method of Chapuis (2004),
which yields good predictions for natural soils in the ranges
0.003 ≤
d
10
≤ 3 mm and 0.3 ≤
e
≤ 1. The range for the effective
diameter
d
10
was recently extended up to 150 mm (Côté et al.
2011; Chapuis et al. 2012).
If the soil sample is homogenous, its GSDC is smooth. This
is not the case for most borehole samples in sandy aquifers.
Therefore, when studying the GSDCs, caution must be taken to
avoid confusing homogenous samples (single layer) with those
made by mixing 2 or 3 small layers. The analysis proceeds with
a modal decomposition (Chapuis 2010; Chapuis et al. 2013),
which provides the GSDC and percentage of each layer in the
composite sample. The equivalent horizontal
K
value (stratified
sample) is then obtained using the composition rule.
3 MEDIUM-SCALE
K
VALUES (SLUG TESTS IN MWS)
The middle scale, about 1 m
3
, is that of permeability tests (slug
tests) performed in monitoring wells.
It is important to use the standard methods to interpret the
slug test data. In Canada, CAN/BNQ 2501-135 is the standard
for an overdamped response (CAN/BNQ 1988, 2008), but there
is no standard for an underdamped response. ASTM, however,
has standards for the underdamped response (ASTM 2012a) and
for the critically damped response (ASTM 2012b).
For overdamped slug tests, the velocity graph method helps
to establish the correct piezometric level (PL) and
K
value for
the test. It also helps to detect several phenomena during the
test. Even if the aquifer is unconfined, and even if the MW is
correctly installed, there are several reasons why the test data
must be corrected by a systematic error on the assumed PL, of a
few centimetres (Chapuis 2009a, b). The velocity graph gets rid
of any systematic error, which may be due to incorrect
calibration of a pressure transducer (PT), waiting time, PT line
slippage, piezometric modification, faulty MW installation, and
unknown PL. However, it cannot make a distinction between
these six errors.
For underdamped slug tests, it is preferable to fit the test data
using a least squares method, instead of a visual fit, and the
verification of three physical conditions must be done for each
tests, otherwise large errors can be made (Chapuis 2012c).
4 LARGE-SCALE
K
VALUES (PUMPING TESTS)
For the large scale of pumping tests, about 10
3
m
3
, precautions
must be taken when installing the pumping well and MWs, and
also when interpreting the pumping test data. The common
theories for unsteady-state are based on some wishful thinking
about drainage, unsaturated seepage and a misleading concept
of specific yield (e.g., Akindunni and Gilham 1992; Chapuis et
al. 2005a). For MWs, it is commonly admitted that two thirds of
them are improperly installed (Nielsen and Schalla 2005).
5 THE SITES
5.1 The Lachenaie site
The site is located 50 km north-east of Montreal. The sand
unconfined aquifer has been used for field training and research.
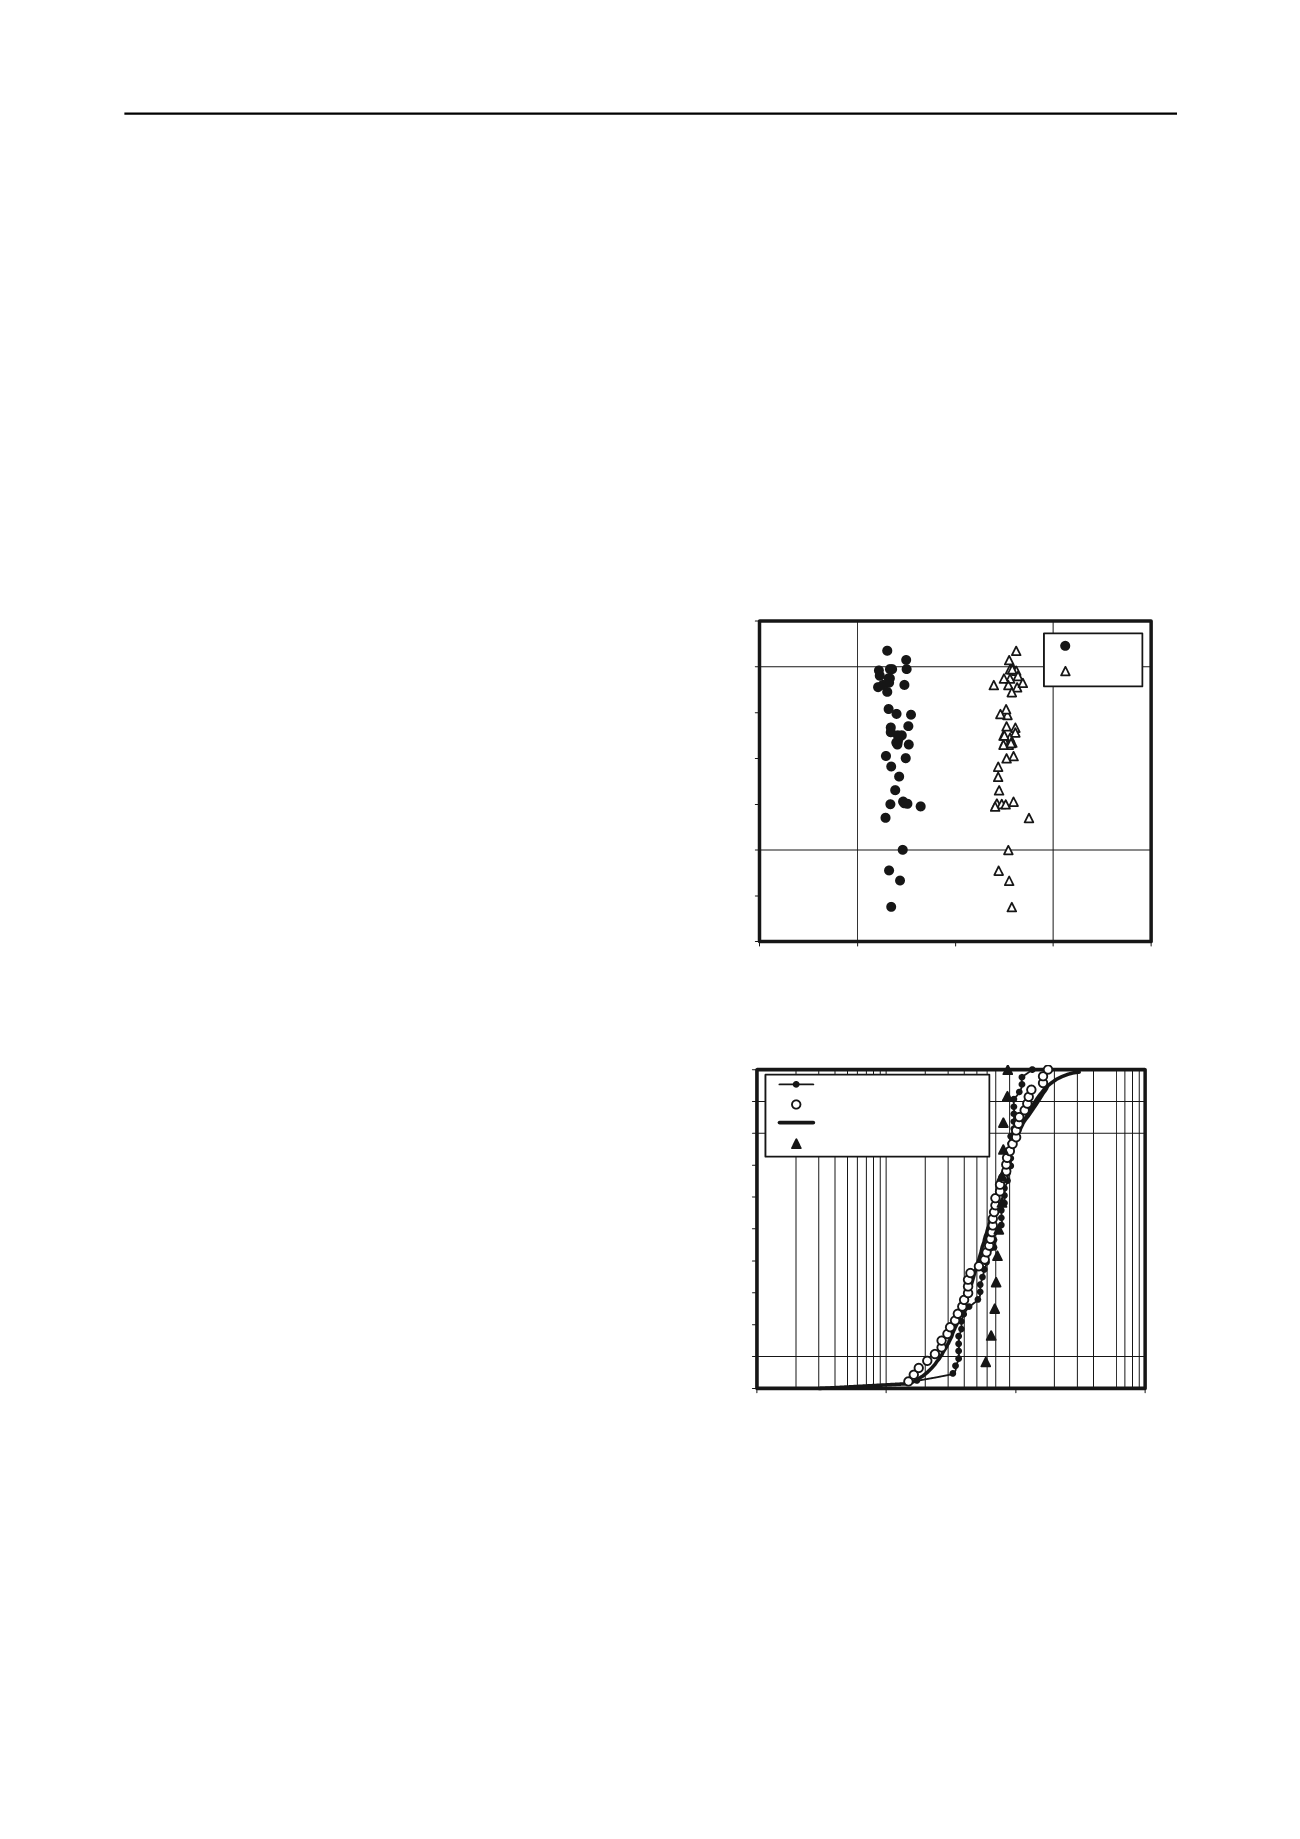
The GSDCs could be correctly fitted using a unimodal
lognormal distribution. The little variability for the mean and
the standard deviation indicate homogeneity (Fig. 1). For the
pumping test, the steady-state drawdown data were used, the
interpretation methods being proven to be reliable (Chapuis et
al. 2005a, b). In this aquifer, the average
K
values at the three
scales are very close, and thus there is no scale effect (Fig. 2).
0
50
100
150
200
250
300
350
-2.0
-1.0
0.0
1.0
2.0
log (mean size) and log (std dev.)
mean sampling depth (cm)
mean
sdt dev.
Figure 1. Lachenaie: modal decomposition of the sand GSDCs.
0%
10%
20%
30%
40%
50%
60%
70%
80%
90%
100%
1.E-03
1.E-02
1.E-01
1.E+00
x = K
(cm/s)
% of cases lower than
x
pred. K (small scale)
K tests in MWs
lognormal best fit MWs
data pumping
Figure 2. Lachenaie: comparison of the
K
values obtained at the small,
medium, and large scales.
5.2 The Shannon site
Shannon is a small town about 30 km north-west of Quebec
City. For the TCE-contamination case, a lot of information was
given in the defendants' expert reports, but without a quality
control, which led to contradictions. The quality control and a
synthesis were done in Chapuis (2009c, 2010, 2013a, b). There
were about 1000 MWs for this huge contamination case.
The aquifer stratification could be considered or not when
analyzing the GSDCs. When it was not, the distribution of


