509
Technical Committee 102 /
Comité technique 102
predicted
K
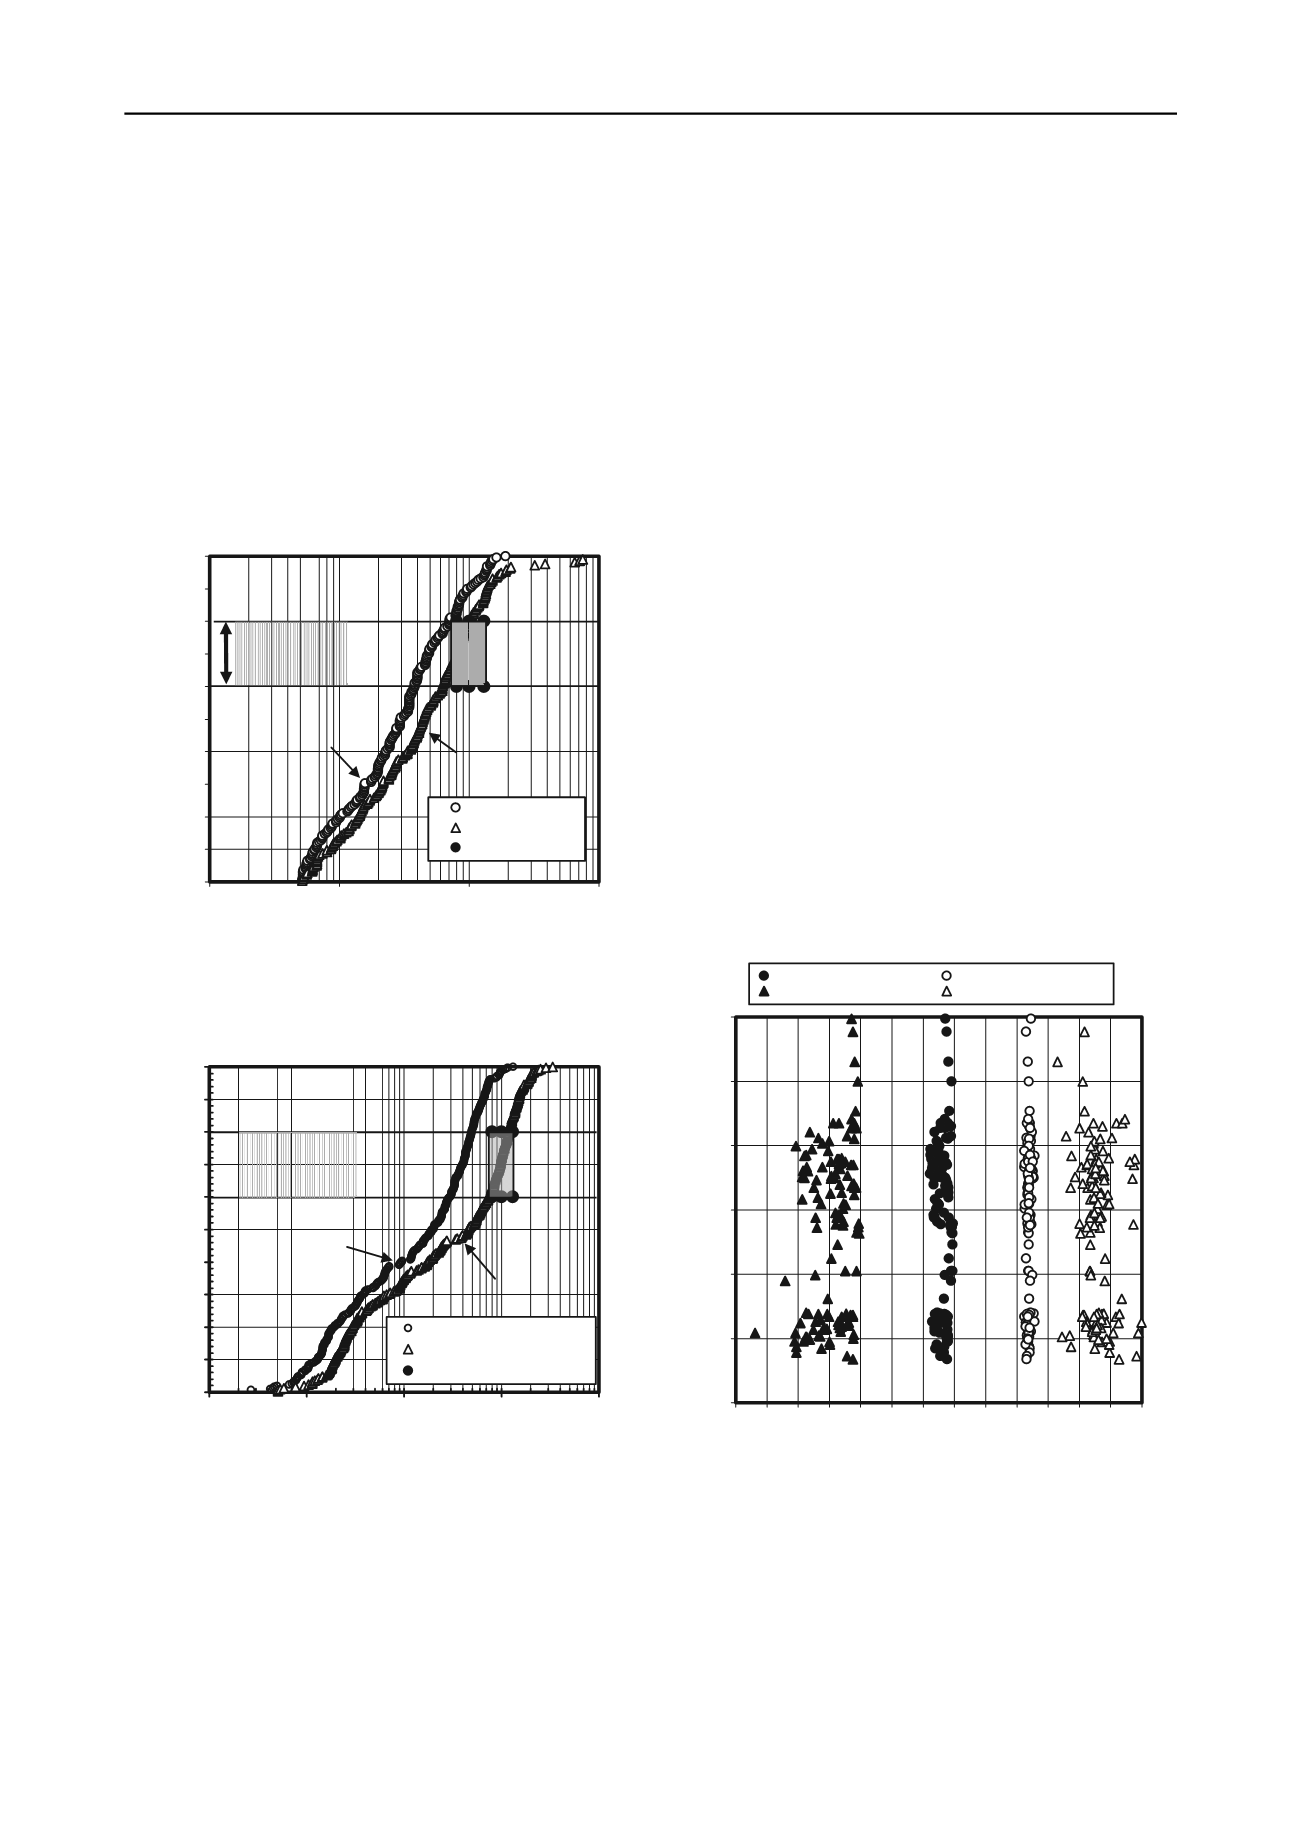
values could not explain the high large-scale
K
values of pumping tests (Fig. 3). When it was, after using a
modal decomposition of each GSDC, the distribution of
predicted
K
values yielded a large-scale
K
value very close to
that of pumping tests (Chapuis 2010, 2013b).
For the slug tests in MWs, Chapuis (2010) showed that the
defendants’ expert reports gave
K
values that were obtained
without following the standards and without making the
required verifications. They were about three times smaller than
the
K
values obtained when following the standards and making
the verifications. When the standards were not respected, the
distribution of the slug test
K
values could not explain the large-
scale
K
values of pumping tests (Fig. 4). When the standards
were followed, the slug test
K
distribution yielded a large-scale
K
value very close to that of pumping tests (Fig. 4).
0%
10%
20%
30%
40%
50%
60%
70%
80%
90%
100%
1.E-05
1.E-04
1.E-03
1.E-02
x
= estimated
K
(m/s)
% of cases lower than
x
homogeneous
stratified
pumping wells
usual range
for
pumping
#
homogeneous
stratified
Figure 3. Shannon:
K
values predicted using the GSDCs, assuming
either homogeneous or stratified samples (modal decomposition) and
large scale pumping tests.
0%
10%
20%
30%
40%
50%
60%
70%
80%
90%
100%
1.E-06
1.E-05
1.E-04
1.E-03
1.E-02
x
= slug test
K
(m/s)
% of cases lower than
x
not following standards
following standards
pumping wells
usual range for
pumping wells
NFS
FS
Figure 4. Shannon:
K
values obtained with slug tests in monitoring
wells (following or not the standards), and large scale pumping tests.
How to perform the modal decomposition of a GSDC, and
that of predicted or measured
K
values, is explained elsewhere
(Chapuis 2013b; Chapuis et al. 2013). These papers also explain
how to predict, for a
K
distribution, the large-scale
K
value
which would be given by a pumping test, in order to logically
compare the data at the three scales. A closed-form equation is
also provided for the soil specific surface, more general than
that of Chapuis and Légaré (1992). According to the detailed
study following the quality control for the Shannon aquifer, all
K
distributions provided a coherent image of the hydraulic
properties in the aquifer. Therefore, there was no scale effect.
5.3 The Sorel site
The Sorel site, 100 km north-east of Montreal, has been used for
many years for field training of students in groundwater
engineering and geophysics. The site is part of the floodplain at
the confluence of the Richelieu River and the St-Lawrence
River. Down to about 5 m deep, the stratigraphy includes many
layers of fine sand (deposited in low velocity water) and silty
clay (deposited in ponds). Over 300 soil samples were
recovered in over 40 boreholes.
The soil samples provided clearly bimodal GSDCs and
K
values (Chapuis et al. 2013). The split-spoon sampler could
recover 30 or more individual layers of silty clay and fine sand,
which were uniform in color. The GSDC modal decomposition
provided results such as those of Fig. 5 for a few boreholes in
the vicinity of the pumping well. The fine sand and silty clay
were fairly homogeneous (Fig. 5). According to the modal
decompositions, the portion between 1.9 and 3.1 m deep had
more clayey silt than the upper and lower portions. The screens
of the pumping well and nearby MWs were installed in the
portion between 3.1 and 4.4 m this confined aquifer.
The horizontal
K
distribution curve was obtained from the
modal decomposition of GSDCs and the
K
composition rule.
The predicted
K
distribution was in good agreement with the
pumping test
K
values, whereas the slug test
K
values were
somewhat below the pumping test
K
values (Chapuis et al.
2013). Due to the fine stratification of fine sand and silty clay
sub-layers, the development of monitoring wells was not
effective. Therefore, the slug tests have slightly underestimated
the horizontal medium-scale
K
value due to smearing between
layers during drilling and MW installation. Therefore, there was
no scale effect for the Sorel highly stratified aquifer.
0
1
2
3
4
5
6
-9 -8 -7 -6 -5 -4 -3 -2 -1 0 1 2 3 4
log of the means and standard deviations
depth (m)
fine sand, mean
fine sand, std dev
clayey silt, mean clayey silt, std dev
Figure 5. GSDCs modal decomposition for stratified samples of Sorel,
showing fairly homogeneous layers of fine sand and clayey silt.
6 CONCLUSIONS
This paper studies the permeability of sandy aquifers at three
scales. The aquifers are stratified or not, which leads to
multimodal or unimodal distributions for grain size distribution
curves. The small scale is that of soil samples: their quality
must be assessed and their GSDC analyzed to check for mixes
of sub-layers before using reliable methods to predict the
K
values. The middle scale is that of field permeability tests for


