520
Proceedings of the 18
th
International Conference on Soil Mechanics and Geotechnical Engineering, Paris 2013
parameters. To do this, we propose an estimation method based
on measuring the dynamic cone resistance (qd) that can be
relatively easily measured on this type of structure.
1.2
Normalisation of qd
Estimating ID% and
’ by using empirical and semi-empirical
relations, first implies normalising qd at a reference stress
corresponding to atmospheric pressure (pa), using the following
equation 1.
q
1N
Cqd
qd
with
c ' v a
q
p C
(1)
where: qd
N1
is the dimensionless normalised dynamic cone
resistance, qd is the dynamic cone resistance, pa is the
atmospheric pressure,
’
v
is the effective vertical stress, “c” is
the normalisation coefficient (0.5 to 0.75).
According to Moss et al. (2006), this reference stress value is
considered as reasonable if the depth/stress relation is taken into
account. According to Salgado et al. (1997) and Moss et al.
(2006), the normalisation coefficient is not only linked to the
intrinsic properties of the soil such as the type of grain and the
physical characteristics of the material (mineralogy,
granulometry, particle shape and texture characteristics), lateral
pressure (K
o
), compressibility, cementation, resistance to
crushing of the particles, etc.
1.3
Experimental approach
Our study is based on the use of cone penetration resistances
(qd) obtained by using the Panda test. The Panda device is a
manual light dynamic penetrometer with variable energy and a
small cone section (2.0 or 4.0 cm
2
) (Gourvès et al. 1997, Benz
2009). The Panda provides the cone resistance qd of the soil as
a function of depth, and is capable of performing a large number
of in situ tests thanks to its small size and its quick
implementation. This device can operate until 6.0 (m) in depth
and for materials having particles size lower than 50.0 (mm).
Table 1. Geotechnical properties of mine tailings. Values and statistical
nalyses of experimental data from three representative tailings dams.
a
No. 1
No. 2
No. 3
Geo.
Prop
Av.
CV
Av.
CV
Av.
CV
s
3.09
4.6
3.36
8.0
3.1
2.2
D
50
0.13
19.0
0.11
15.2
0.25
8.7
F.C
28.0
28.7
33
26.3
17
10.0
IP
0
0
0
0
0
0
dmax
18.2
6.2
20.8
8.0
18.5
2.3
d
17.5
6.6
20.1
8.2
18.1
2.9
w
nat
11.0
22.3
3.3
43.1
7.5
27.3
qd
4.8
50.6
2.87
45.9
1.95
52.8
N
60
22
62.5
12
58.8
-
-
s: specific weight (kN/m
3
), D
50
: median diameter (mm), F.C: percentage
of fines less than 80 (µm), IP: plasticity index (%),
dmax: Proctor dry
density (kN/m
3
),
d: dry density in situ (kN/m
3
), w
nat
: water content in-situ
(%), qd: cone resistance PANDA test (Mpa), N
60
: corrected penetration
resistance index, Av: average, CV: coefficient of variation (%).
A serie of Panda tests have been performed on the mine
tailings coming from three dams studied, under controlled
laboratory conditions in a calibration chamber. The following
procedure was used:
a) Determination of the physical characteristics of 3 samples of
mine tailings of copper sulphates (Table 1).
b) Performing dynamic cone resistance tests in a calibration
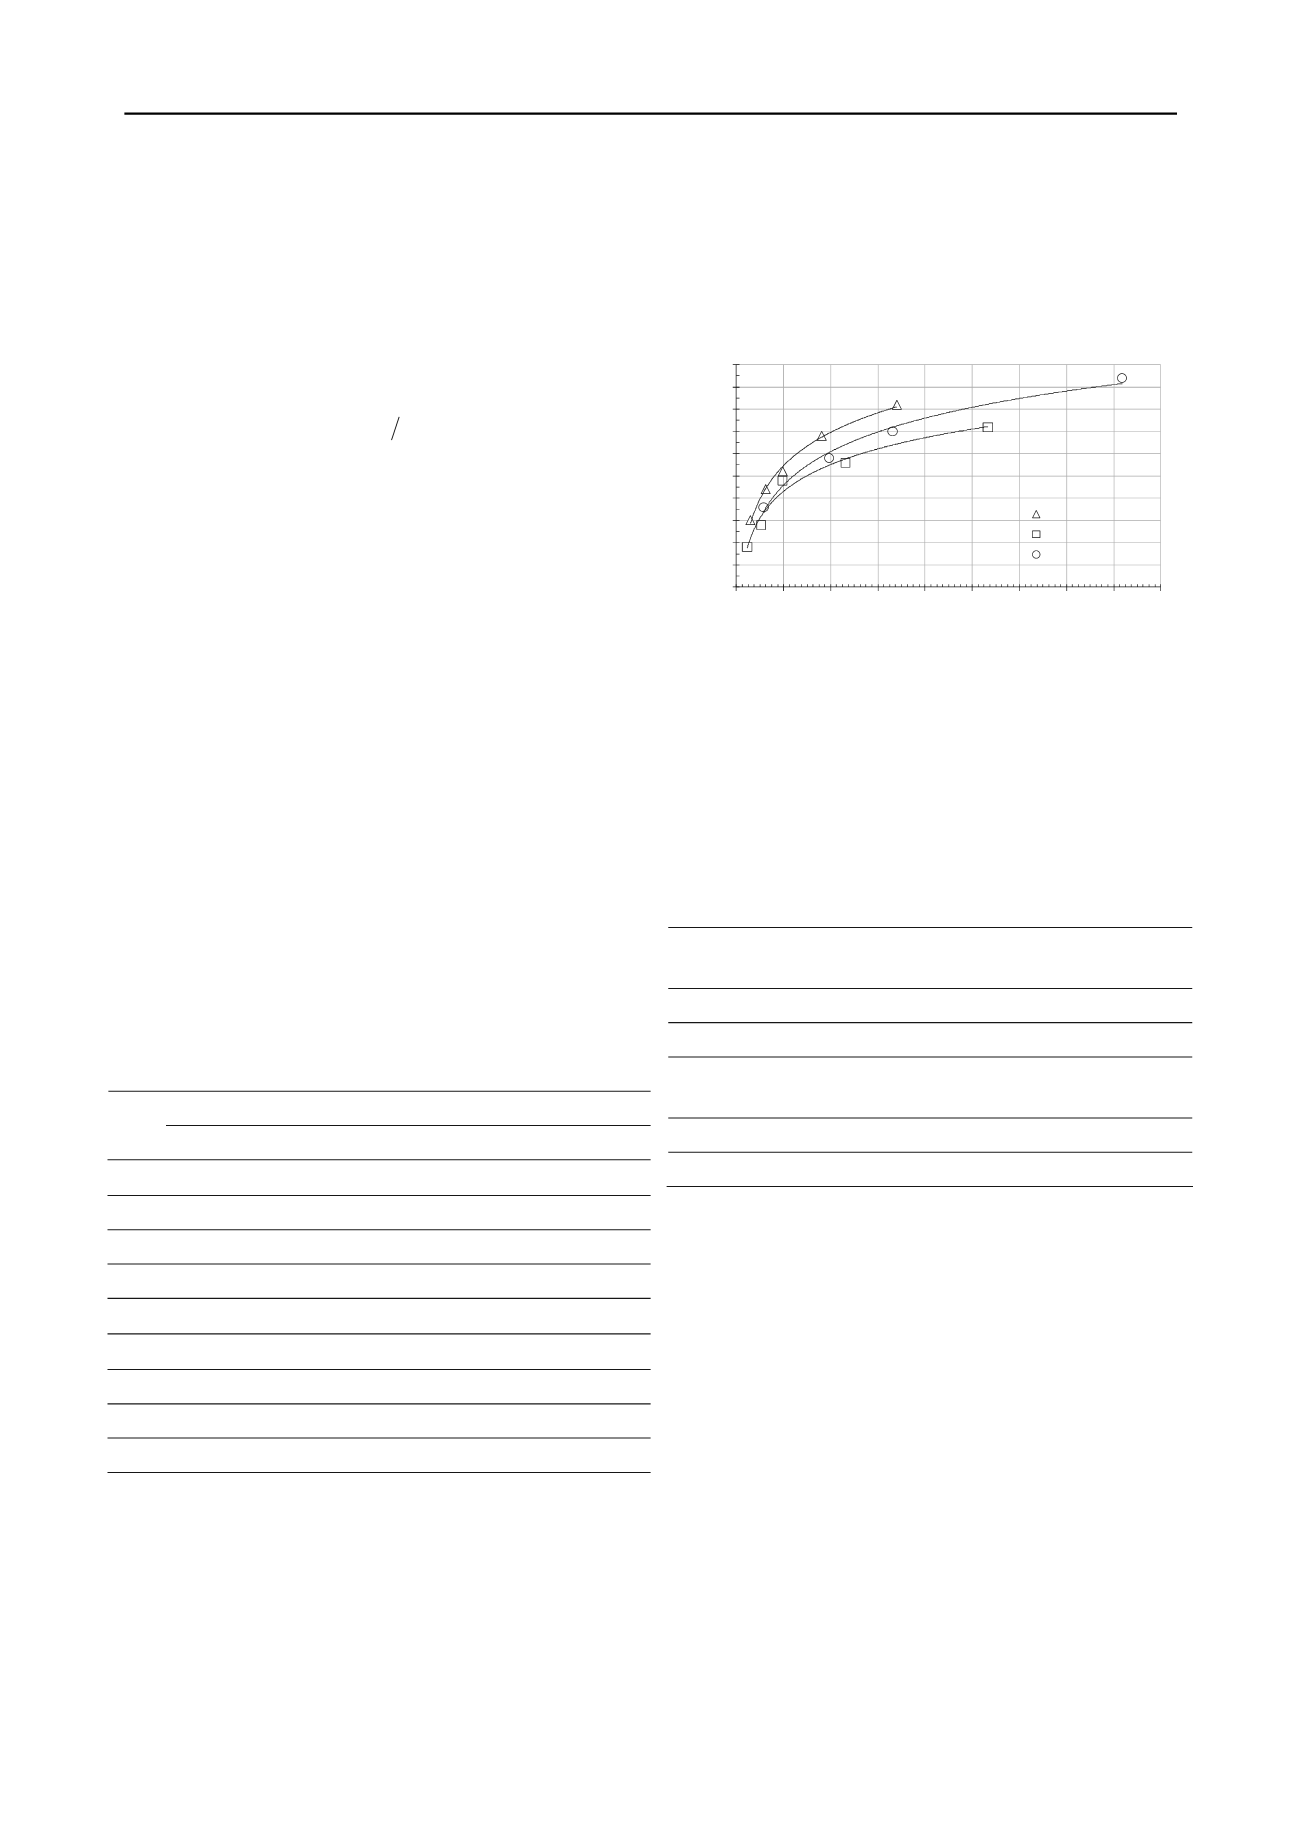
mould for different states of density to obtain the relation
d/qd
(calibration curve). A logarithmic relation can be observed, in
agreement with previous results (Chaigneau et al. 2000) for this
type of material. Figure 1 gives the calibration curves
d/qd
obtained for dams No. 1, No. 2 and No. 3.
c) Normalisation of qd at atmospheric pressure (equation 1).
d = 1,0811ln(qd) + 15,983
R² = 0,9948
d = 0,8693ln(qd) + 15,552
R² = 0,9755
d = 1,086ln(qd) + 15,543
R² = 0,9883
Figure 1. Relation
d/qd for tailings dams No. 1, No. 2 and No. 3 in the
study.
1.3.1
Relation ID% = f (qd
N1
)
The equivalence between the state of density (% Optimum
Proctor Normal) and ID% was estimated for each calibration
test. On the basis of the normalised cone resistance (qd
N1
), and
by considering the classification modified by Skempton (1986)
and adapted by Villavicencio (2009), we estimated ID%
associated with each degree of compaction (table 2).
Table 2. Estimation of the state of compaction and associated
echanical behaviour for silty sands. Villavicencio (2009).
m
qd
N1
ID%
State of
compaction
Mechanical
behaviour
Liquefaction
potential
0 – 17
0 – 15
Very low
Contractant
High
17 – 69
15 – 55
Low
Contractant
High
69 – 82
55 – 60
Average
Contractant
/Limit
Limit
82 – 162
60 – 80
Dense
Dilatant
Null
162 – 326 80 – 100
Very dense
Dilatant
Null
Studies conducted by Troncoso (1986) have concluded that
for mine tailings with a percentage of fines around 15% , with
confining stresses between 50 kPa and 350 kPa, ID% below
50%-60% is an indicator of contractancy. Under this condition,
if the material is saturated or partially saturated, under seismic
conditions, the risk of liquefaction is real. On the other hand,
the material will tend to a dilatant behaviour for a relative
density over these values. Verdugo (1997) have conducted an
analysis of the variation of the minimum and maximum
densities (Vibratory and Proctor compaction) both with mine
tailings and similar soils (sands and silts) with different
percentage of fines. They conclude that in situ ID% of 60% is a
very reasonable compaction value with a satisfactory
mechanical behaviour (dilatancy) in structures that allow certain
degree of deformation such as the tailing dams.
An empirical model was adapted by using a simple
regression on all the pairs of experimental data (qd
N1
, ID%) for
the three samples of mine tailings. Since we consider that mine
tailings can be globally classified in a single geotechnical class,
it is possible to estimate ID% as a function of the resistance
qd
N1
by a single relation. The model used is given by the
following equation:
4.65
ln5.28 %
1
N
qd
ID
with 10.0 ≤ qd
N1
≤ 326.0
(2)
14,0
5
0
5
0
5
0
5
0
5
19,0
0,0 2,0 4,0 6,0 8,0 10,0 12,0 14,0 16,0 18,0
Dry density (KN/m
3
)
Dynamic cone resistance,qd (MPa)
14,
15,
15,
16,
16,
17,
17,
18,
18,
Tailings Dam No 1
Tailings Dam No 2
Tailings Dam No 3


