521
Technical Committee 102 /
Comité technique 102
Figure 2 shows that the results of the model are very close
to the experimental results. In addition, the relation proposed by
Tatsuoka et al. (1990) was used by replacing qc
N1
by qd
N1
.
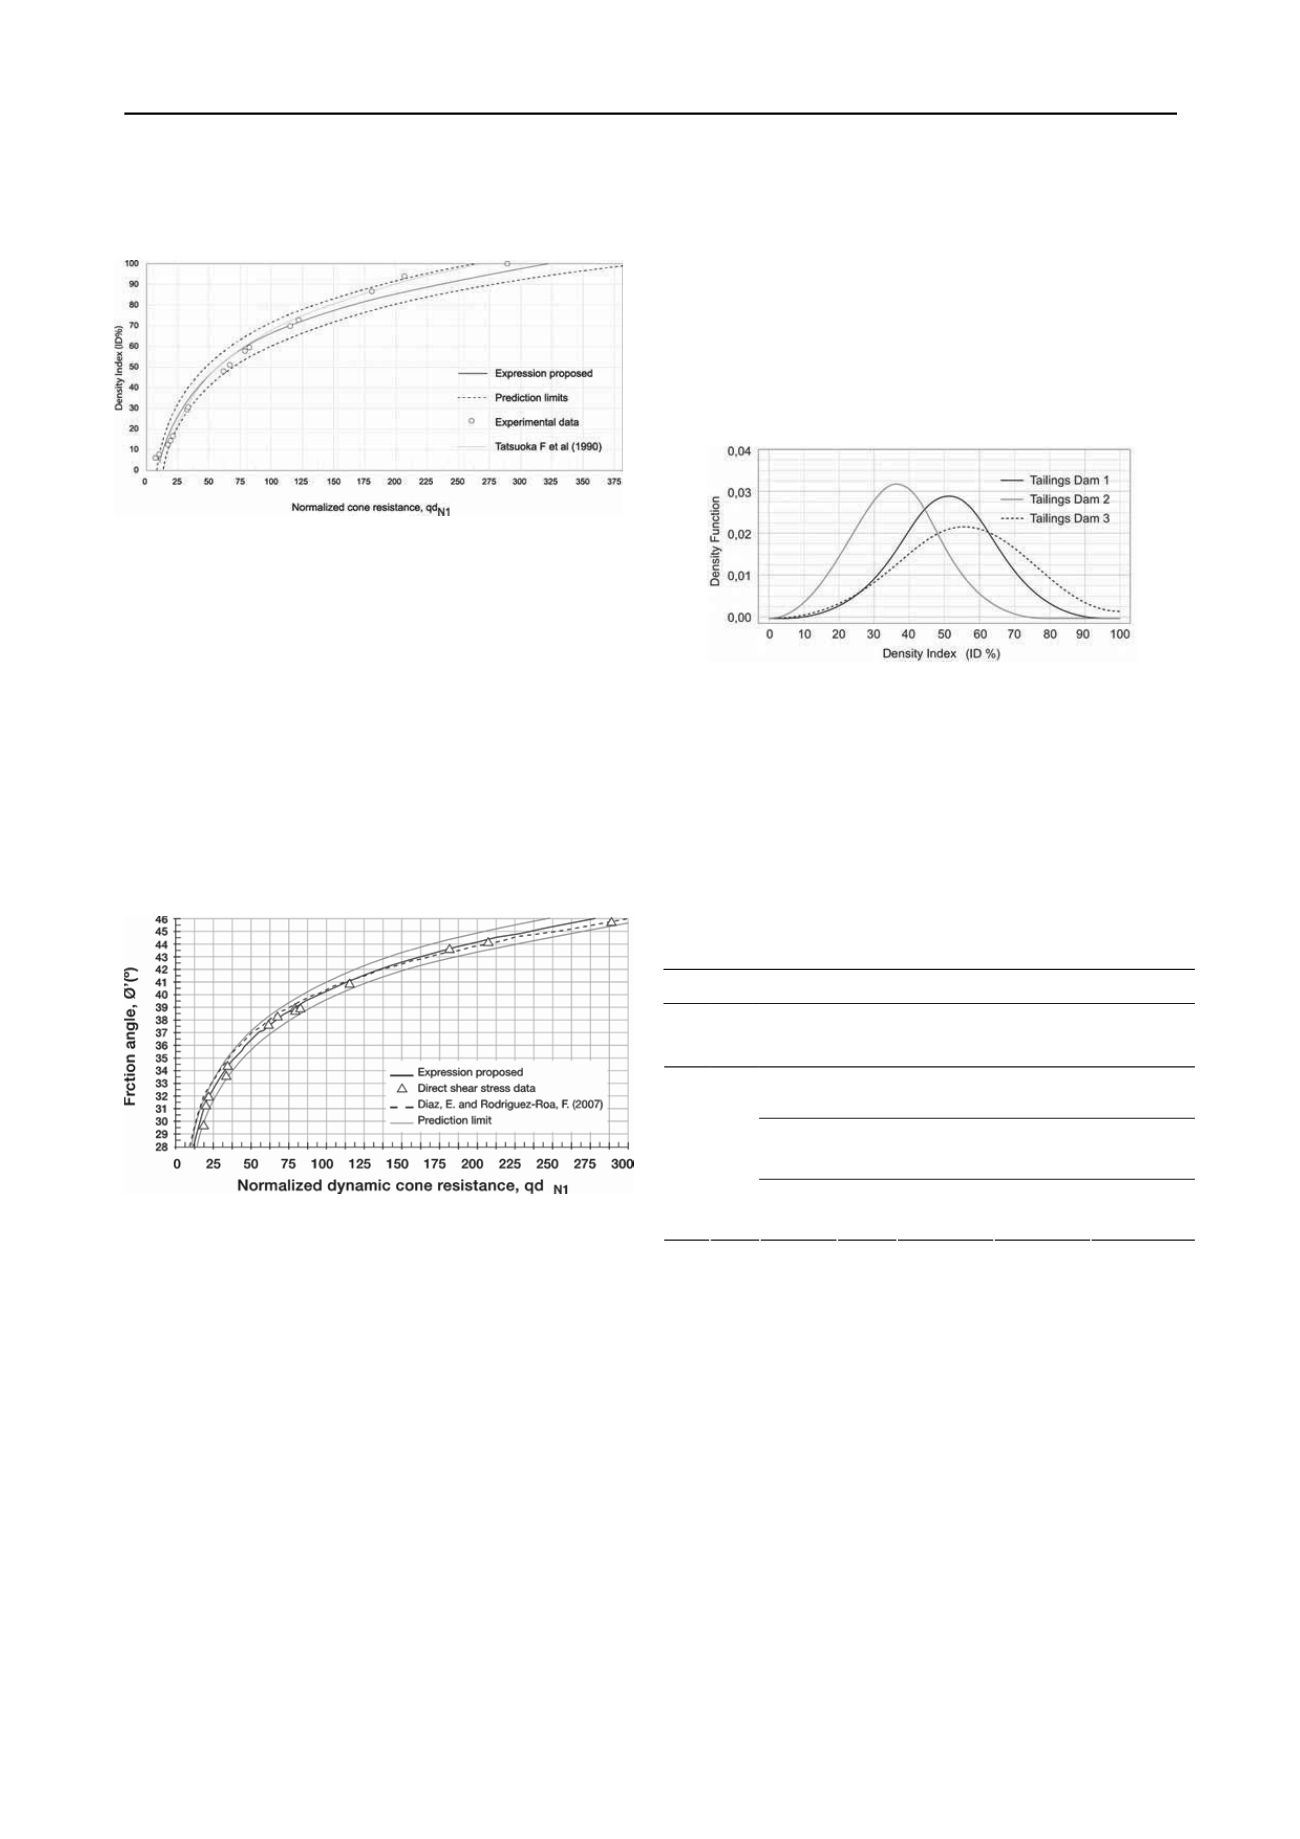
Figure 2. The experimental points, relations proposed and references for
estimating the ID% of mine tailings as a function of qd
N1
.
1.3.2
Relation
’ = f (qd
N1
)
Since we considered that mine tailings can be globally classified
within one geotechnical class, it is possible to estimate
’ as a
function of the resistance of qd
N1
by a single relation. To do
this, a regression analysis was performed on all the pairs of
experimental data (qd
N1
,
’) obtained during the calibration
tests, for the three samples of mine tailings (figure 3). The
model used is given by the following equation:
N1
qd ln 5.54
14.79
'
with
10.0 ≤ qd
N1
≤ 280.0
(3)
As it can be seen on figure 3, the results of the model are
very close to the experimental results. In addition, the relation
proposed by Díaz and Rodríguez-Roa (2007) was used by
replacing qc
N1
by qd
N1
.
Figure 3. Experimental points, proposed and bibliographic relations for
estimating
’ of mine tailings as a function of the qd
N1
.
This result is in full agreement with the works already
carried out on the correlation between qc and qd obtained with a
Panda penetrometer. Indeed, it has been proven (Chaigneau et
al. 2000, Lepetit 2002) that in the case of sands and silty sands,
the average value obtained for the ratio qd/qc is equal to 1.03.
More recent research performed by Rahim et al. (2004)
confirmed the relation between qd and qc. Their results obtained
for granular soils have been demonstrated experimentally and
analytically on the basis of the cylindrical cavity expansion
theory and that of cavitation collapse.
The resistance qd obtained with a light Panda penetrometer
can therefore be assimilated with qc. In conclusion, in the case
of mine tailings:
(1) density index (ID%) and effective friction angle (
’) can
be deduced very precisely from the normalised cone penetration
resistance qd
N1
by a two single relations,
(2) relation qd
N1
= qc
N1
is very well validated which allows
using either static or dynamic penetrometers according to need.
1.4
Application case: density index (ID%) and associated
mechanical behavior
On the basis of equation 2, it is possible to estimate the
profiles of the density index (ID%) as a function of depth from
the penetrometric tests performed in situ. The adaptation of the
correlation presented in table 2, allows estimating the
mechanical behaviour of mine tailings as a function of ID%. At
global scale (measurements processed at the scale of the tailings
dam by using the ID% distribution obtained from all the
penetration tests performed), the distribution of all these ID%
values for each dam can be adjusted by a normal law (Figure 4).
Figure 4. Density function of ID%. Proposed relation for tailings dams
No. 1, No. 2 and No. 3 in the study.
At global scale, the density function makes it possible to
obtain a global idea of the mechanical behaviour of the mine
tailings stored, by considering the limit value of ID%, which
permits classifying contractant or dilatant behaviour and
associate in a qualitative way the liquefaction potential. As an
example, table 3 presents a probabilistic analysis in global scale
of the variability of ID% and the mechanical behaviour for the
tailing dam
No.1
.
Table 3. Density index (ID%) and associated mechanical behaviour.
nalysis at global scale. Tailings dam No. 1.
A
ID%
Analysis of the mechanical behavior
Av.
C.V
%
ID% % of
values
State of
compaction
Mechanical
behaviour
Liquefaction
potential
< 55
58
Low
Contractant
High
55 – 60
13
Average
density
Contractant
/Limit
Limit
52 28.3
60 – 100 29
Dense to
very dense
Dilatant
Null
At a local scale (measurements processed at the scale of
each penetration test, by using the ID% distribution), the
distribution of all these ID% values can then also be adjusted by
a normal law (figures 5a, 5b). The so-obtained results are
consistent with the compaction test performed during the
construction of the three tailings dams.
The results are similar for the three dams, they show that a
local test can be used to estimate ID% for each penetration test,
with sufficient precision provided that the calibration tests have
been carried out on the material characteristics of the dam at the
scale of the structure concerned. The variability of ID% and the
soil mechanical behaviour associated, allows to estimate in a
first stage, the liquefaction potential of tailings dams in both
scales, global and local, and identify in a local scale the zones
with lower strengths through a layer by layer penetration test
(Figure 6).
The evaluation of the risk of liquefaction has been
expressed in an equation formulated by Seed and Idriss (1981).
The classical method compares locally the ratio of the cyclic
resistance of the soil (CRR) with the ratio of the cyclic shearing
stress ratio (CSR) stemming from seismic stress. The notion of
liquefaction potential is therefore linked to the fact that ratio


