1303
Technical Committee 202 /
Comité technique 202
The tunnel structure 2 above the belt conveyor is founded by
the vibration-free CMC method. For the construction of the
15 m tall embankment 70 m wide at its base, the stone columns
technology were used.
Figure 6 gives an overview of the different improvement
techniques carried out in the area of the belt conveyors
structure 2. The longitudinal section elevations showed a height
difference of respectively 1.75 m. The shallow stone columns
reach 10 m to 15 m deep.
Figure 6. 15m high difference including ripping holes for the two
devices RSV, CMC directly on BW2 and pressumeter PMT in front.
4 RESULTS OF THE SOIL IMPROVEMENT
Hereafter, examples of results for the stone columns treatment
area are shown. Test areas and boring before and after treatment
were performed near the highest embankment section to be able
to derive the soil parameters of the calculation model.
The Menard pressuremeter tests were performed within the
stone columns and in the center of the grid of installation.
Figure 7. Execution of the Ménard pressuremeter between and centrally
in the columns
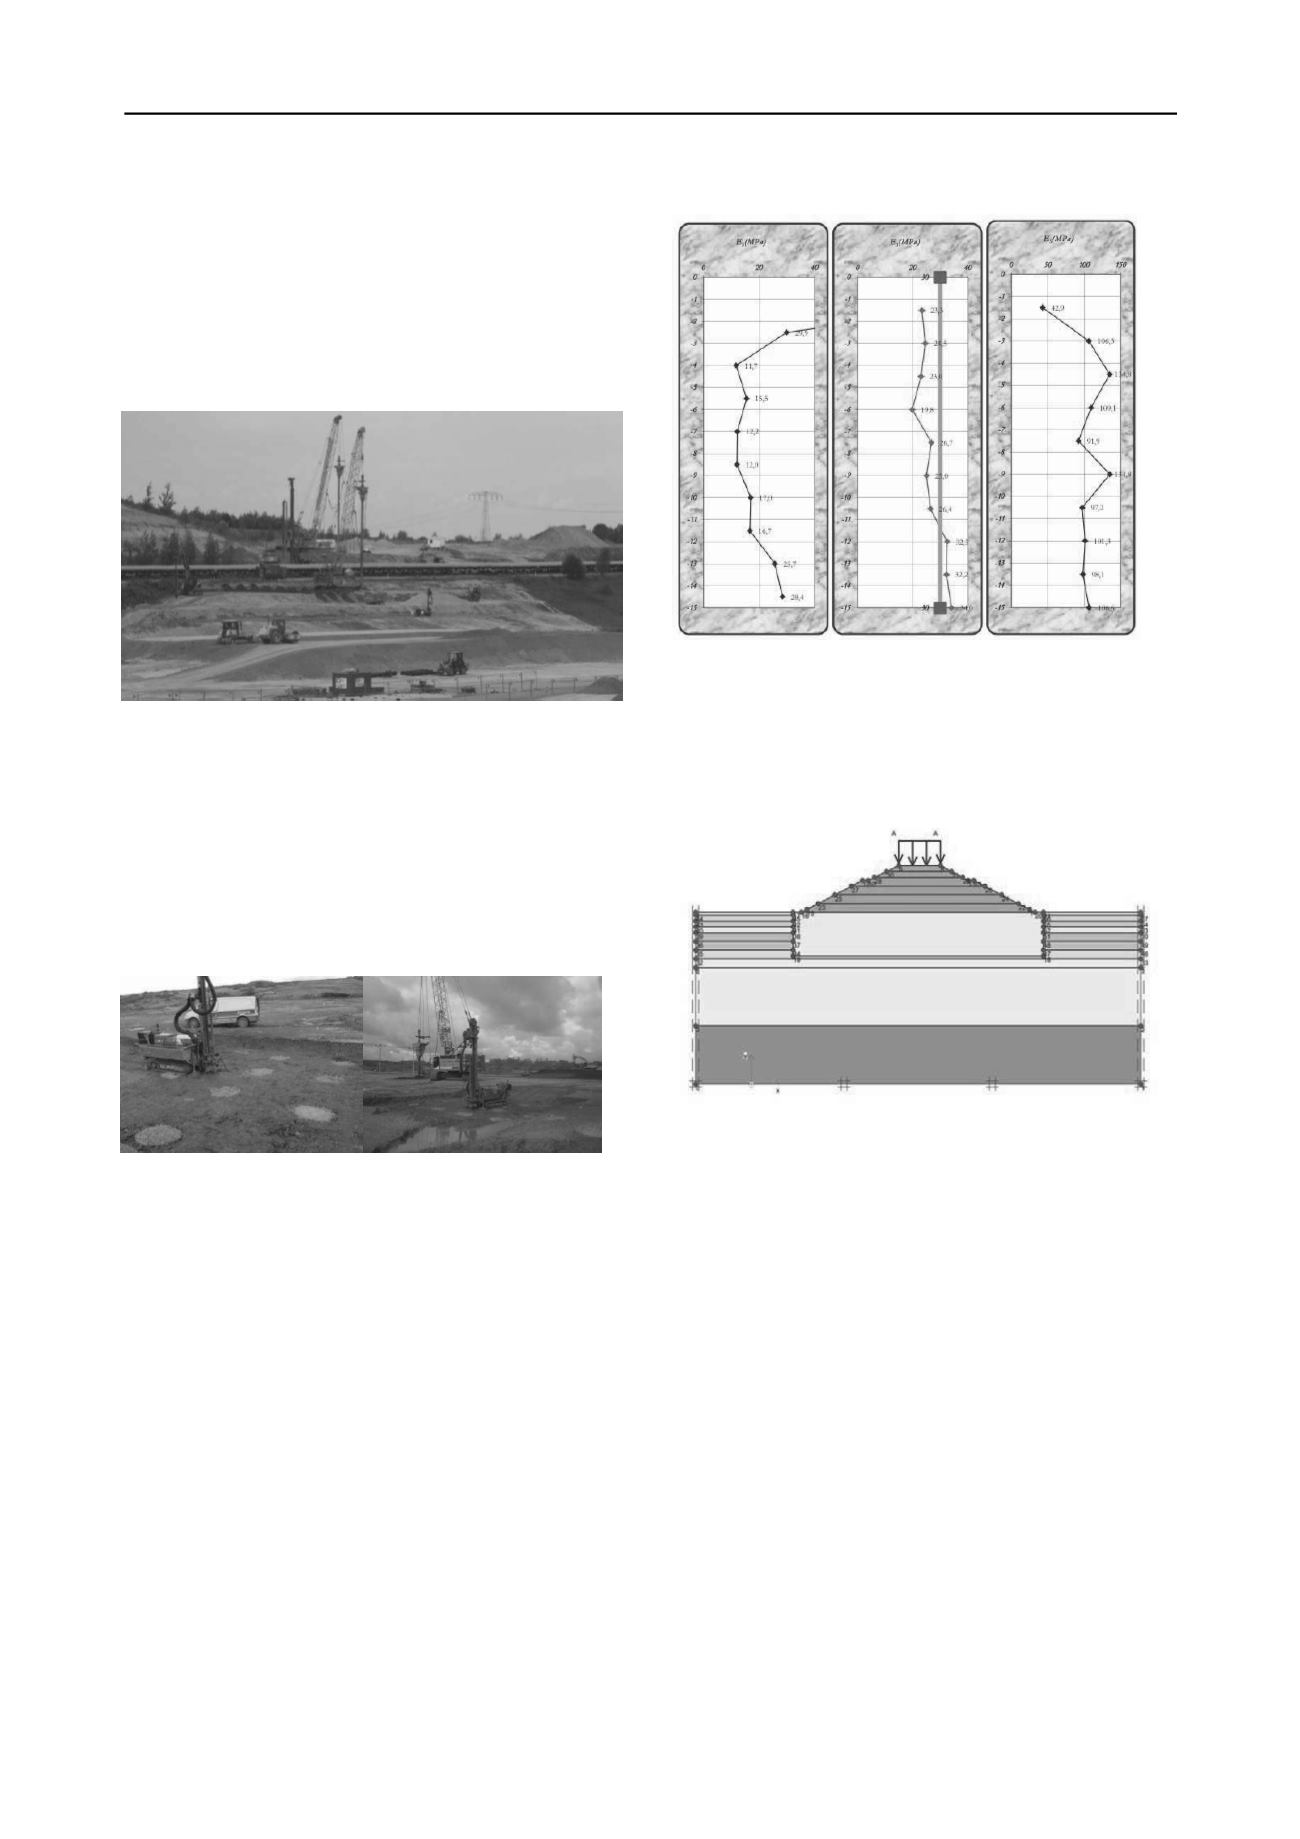
Due to the compaction at optimum proctor water content
corresponding to figure 8 most often an improvement between
the columns with the factor of 2 was measured. With the mean
stiffness modulus of E
c
= 100 MN/m
2
in the columns with at
least 70 cm diameter, this results in a 3 times higher design
relevant modulus of E
s
=30 MN/m
2
for the improved ground.
The Stiffness modulus was doubled after treatment in the
center of the grid of installation, in between columns. This fairly
remarkable result was made possible by the water content close
to the optimum Proctor of the deposits of the mining ground,
and also by the powerful V23 vibrator. A transfer of these high
values to other constructions projects without these optimal
conditions is not possible and it is highly recommended to use a
project-specific calibration with test fields and the Ménard
pressuremeter for other projects.
The results of the cone penetration tests also showed an
improvement factor of 2. It should be noted that the initial
values may have been too low. The improvement as shown by
CPT`s is similar to the Ménard pressuremeter. The stiffness
modulus in cohesive soils can only be measured by
pressuremeter and oedometer tests on undisturbed soil samples.
Preliminary investigation between columns
centrally in columns
Figure 8. Results from in-between and at the center of the columns
5 NUMERICAL ESTIMATION OF SETTLEMENT
Based on the design soil parameters, the settlement calculation
was created in the course of a Diploma thesis (Vogel 2011) with
the PLAXIS software.
Figure 9. CAD model and PLAXIS model
The layers of the fill deposit from ground level up are
divided per figure 9 into different layers. The first 20 meters
from the edge of the model to the toe of the embankment are
modelled using the thin layered structure of the graded soil
charactistics of the dump.
The improvement depth by stone columns below the
embankment was 15 m. This improved ground beneath the dam
is modelled using a composite layer with a composite average
modulus E
s
= 30 MN/m
2
.
The last two layers of fill are assumed to be each 20 m thick
at the lower part of the model domain.
As part of the thesis (Vogel 2011), different behaviour laws
for the modelling of the stress-strain relation of the fill material
were compared and each corresponding calculations resulted in
very variable estimation of the settlements. Between the linear-
elastic, perfectly plastic Mohr Coulomb model with one meter
expected settlements to the more realistic elastoplastic
Hardening Soil model, a difference of half a meter in the
estimated long term settlement were calculated using PLAXIS
software.
In this paper, we present the results of the Hardening Soil
model, where the stiffness modulus for the settlement
calculation for the next load level are sequentially recalculated
and increased after each load level according to oedometer and
pressuremeter test results.
Each of the following six stages corresponds to an
embankment height increase of nearly 3 m with corresponding


