1308
Proceedings of the 18
th
International Conference on Soil Mechanics and Geotechnical Engineering, Paris 2013
0
20
40
60
80
100
0.0
0.2
0.4
0.6
0.8
1.0
1.2
1.4
1.6
1.8
Amount of sand (%)
Before Tamping
After Tamping
0
20
40
60
80
0.6
0.8
1.0
1.2
1.4
1.6
1.8
2.0
2.2
100
c
Amount of sand (%)
Before Tamping
After Tamping
Figure 14. Relationships of
u
2
and
0.036
0.040
0.044
0.048
0.052
0.056
0.2
0.3
0.4
0.5
0.6
0.7
0.8
u
2
(mm)
Before Tamping
After Tamping
0.036
0.040
0.044
0.048
0.052
0.056
0.002
0.004
0.006
0.008
0.010
0.012
u
2
(mm)
Before Tamping
After Tamping
Figure 17. Relationships of
and % sand
0
20
40
60
80
0.000
0.002
0.004
0.006
0.008
0.010
0.012
100
Amount of sand (%)
Before Tamping
After Tamping
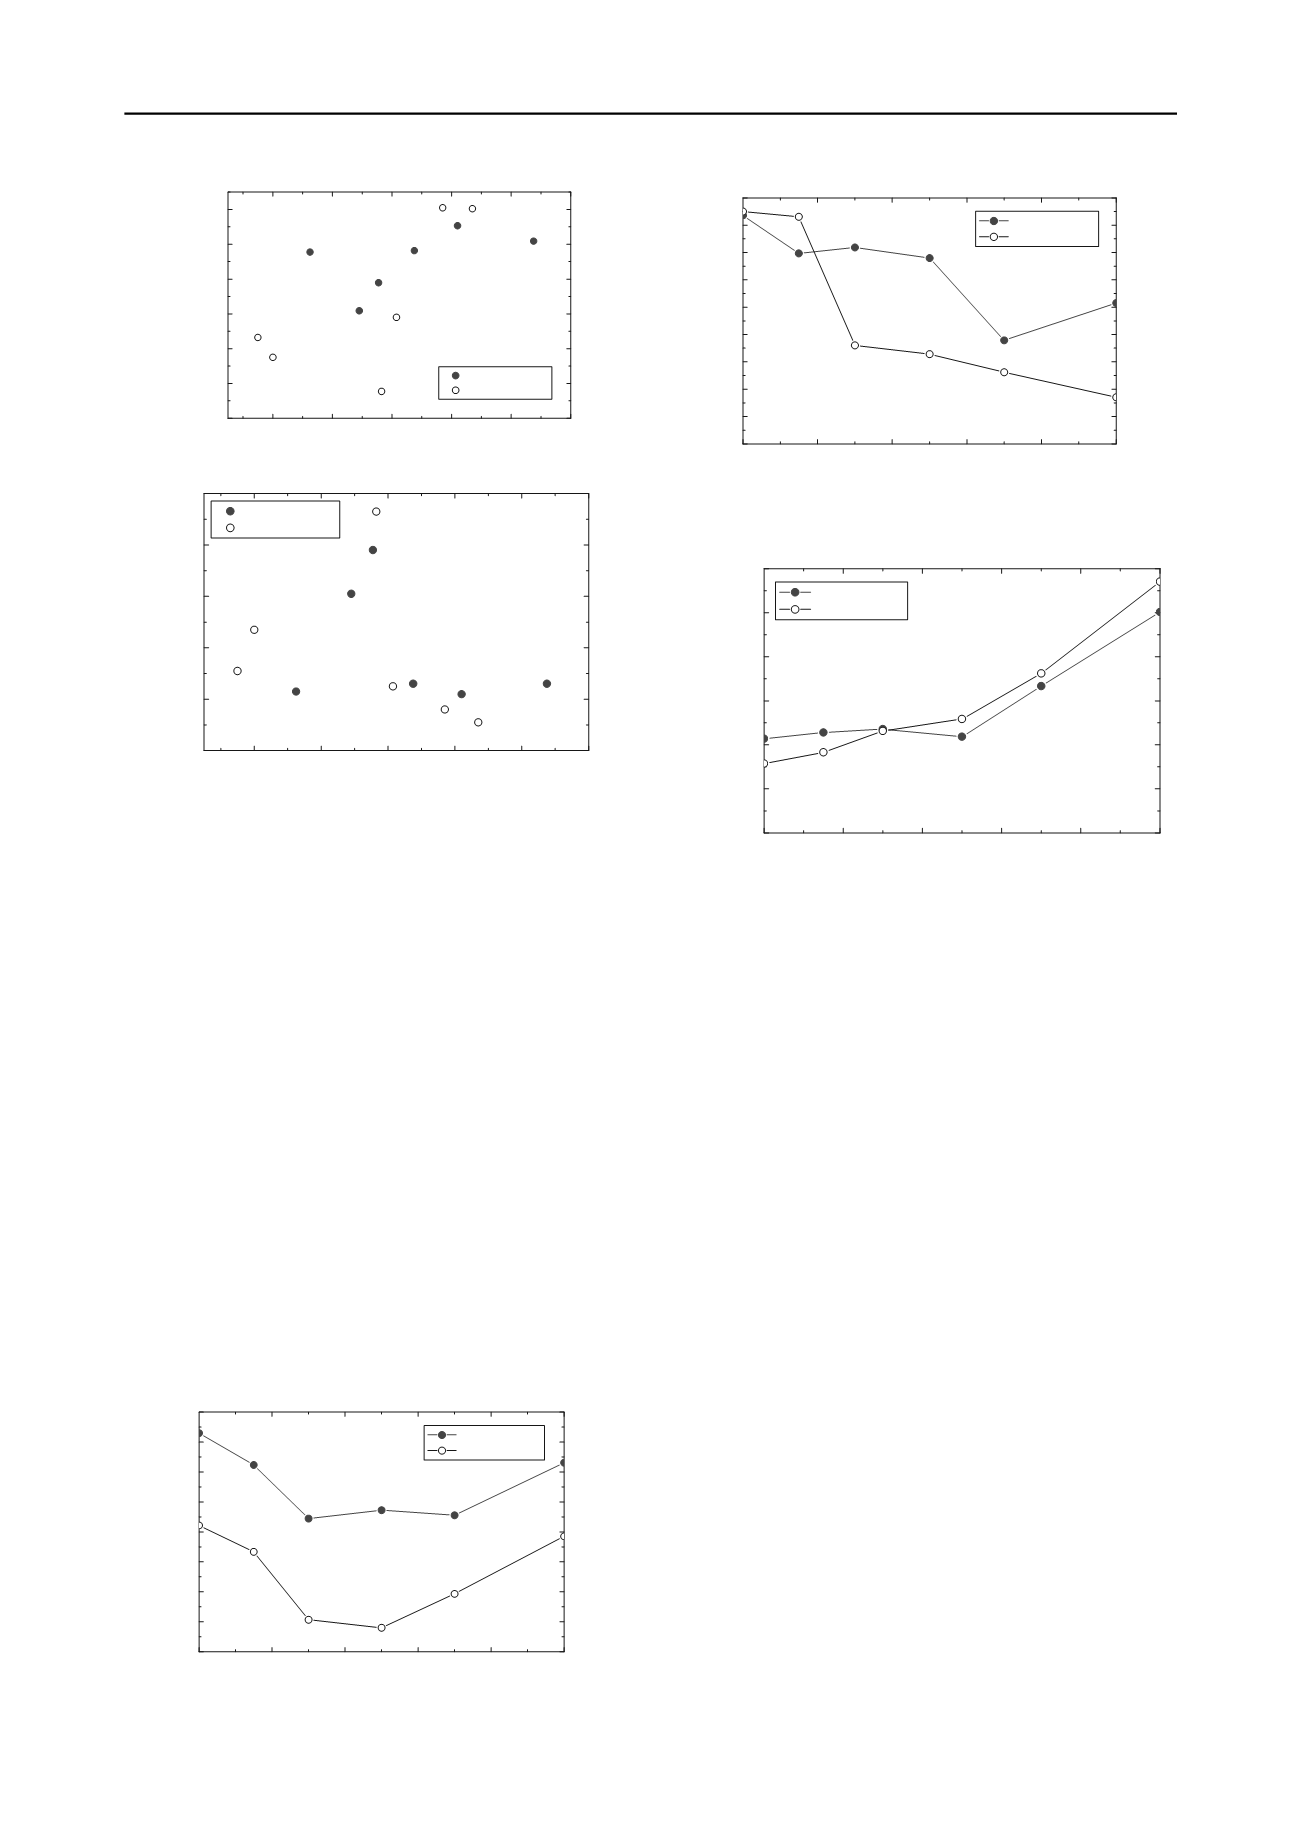
Figure 15. Relationships of
u
2
and
3.3 Effects of tie tamping application on settlement
characteristics
Figure 18. Relationships of
and % sand
Figures 16-18 show how
c
,
and
change with %sand. Figure
16 shows that
c
, parameter indicating initial settlement amount,
reduces until 30-50% sand and then increases, almost same as
how
e
max
and
e
min
change with %sand (Figure 3). While
parameter indicating period of initial settlement process,
reduces with %sand,
, parameter indicating rate of residual
settlement, increase with %sand. The results of
can be
interpreted as initial settlement period increases with degree of
fouled ballast (i.e., increasing of %sand). The results of
can be
interpreted as rate of residual settlement increases with degree
of fouled ballast (i.e., increasing of %sand).
4 CONCLUSIONS
The effects of sand intrusion into ballast and tie tamping
application on settlement characteristics were investigated using
series of cyclic loading model tests. The following conclusions
were derived from this research:
(1) The characteristics of the initial settlement process are
altered considerably after tie tamping application; especially if
ballast is mixed by more than 30% fine materials.
As shown in Figure 16,
c
reduces with %sand up to 30-50% and
then increases. This tendency is same for both before and after
tie tamping application. However, change of
with %sand is
more after tie tamping application for the specimens with more
than 15% sand. That’s, initial settlement period increases
significantly with %sand after tie tamping application (Figure
17). The results also showed that rate of residual settlement is
higher after tie tamping application for the specimens with more
than 30% sand (Figure 18). That’s, tie tamping application
seems effective for fouled ballast mixed with up to 30% fines.
(2) Rate of residual settlement increases after tie tamping
application if ballast is mixed by more than 30% fine materials.
Therefore, tie tamping application seems effective for fouled
ballast with less than 30% fines.
5 ACKNOWLEDGEMENTS
Japanese Government is acknowledged for providing financial
assistance to the first author to study in Yokohama National
University, Japan through a Monbukagakusho scholarship.
6 REFERENCES
Indraratna B., Shahin M., Rujikiatkamjorn C. and Christie D. 2004.
Stabilisation of ballasted rail tracks and underlying soft formation
soils with geosynthetics grids and drains. GeoShanghai
International Conference, Shanghai, China, June 2-4, 2006.
Kumara G.H.A.J.J., Hayano K., Ogiwara K. and Takeuchi M. 2012.
Fundamental study on the simple evaluation methods for particle
size distribution and maximum/minimum void ratio of sand-
gravel mixtures, 2
nd
International Conference on Transportation
Geotechnics, Hokkaido, Japan, 572-577, September 10-12, 2012.
Sekine E., Ishikawa T. and Kouno A. 2005. Effect of ballast thickness
on cyclic plastic deformation of ballasted track, RTRI Report, 19
(2), 17-22 (in Japanese).
Figure 16. Relationships of
c
and % sand


