1306
Proceedings of the 18
th
International Conference on Soil Mechanics and Geotechnical Engineering, Paris 2013
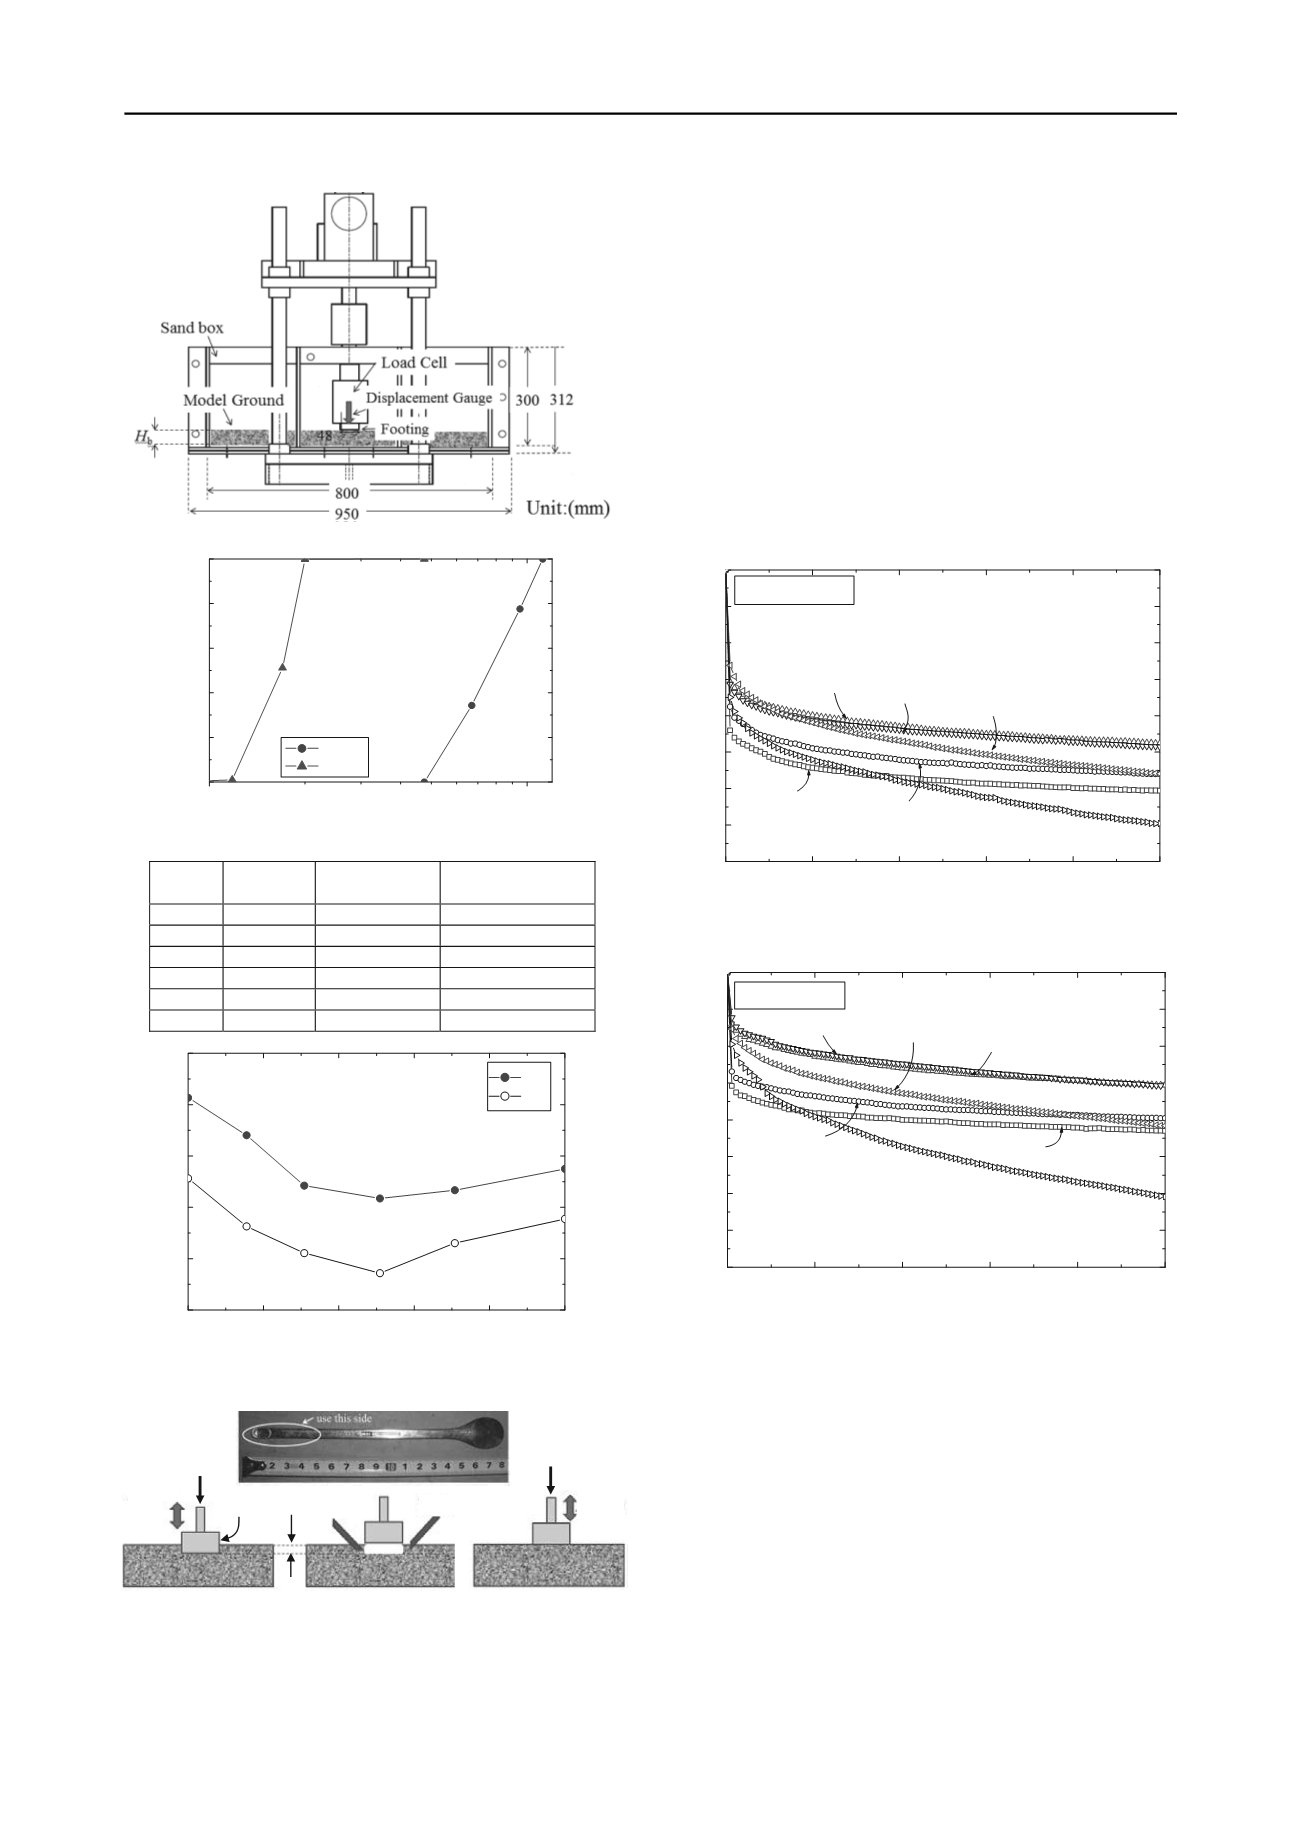
Figure 1. Model test apparatus for model test
0
20
40
60
80
100
3.2
2.8
2.4
2.0
1.6
1.2
0.8
0.4
0.0
Before Tamping
100% sand
70% sand
50% sand
30% sand
15% sand
Fresh ballast
Settlement,
S
(mm)
No of loading cycles,
N
100
3.2
2.8
2.4
2.0
1.6
1.2
0.8
0.4
0.0
0
20
40
60
80
After Tamping
70% sand
15% sand
50% sand
30% sand
100% sand
Fresh ballast
Settlement,
S
(mm)
No of loading cycles,
N
Figure 2. PSDs of gravel and M sand
Table 1. Model test conditions
Case
No
% sand
Dry density,
(kg/m
3
)
Relative density,
D
r
(%)
1
0
1519
80
2
15
1698
80
3
30
1829
80
4
50
1929
80
5
70
1788
80
6
100
1684
80
Figure 3. Max and min void ratios vs. % sand (Kumara et al., 2012)
Figure 4. The tool and procedure used for simulating tie tamping
application
3 RESULTS
3.1 Effects of PSDs on settlement characteristics
Figures 5 and 6 show the results of settlement,
S
with no. of
loading cycles,
N
for fresh ballast (i.e., gravel) and fouled
ballast (i.e., 15, 30, 50, 70% and 100% sand) cases before and
after tie tamping application respectively. It clearly shows that
fouled ballast alters the settlement characteristics of fresh ballast
significantly, both before and after tie tamping application. As
shown in Figures 5 and 6, the smallest settlement was observed
in cases of 30 and 50% sand specimens. The smallest settlement
observed for 30 and 50% sand cases can be understood from the
results of void ratios,
e
max
and
e
min
with % sand as shown in
Figure 3 where it shows minimum values of void ratios were
observed for the mixtures with 30-50% sand.
1
2
3 4 5 6 7 8 9
0
20
40
60
80
100
10 12
Percent passing (%)
Grain size,
D
(mm)
Gravel
M sand
Figure 5. Relationships between no. of loading cycles and settlement
before tie tamping application
0
20
40
60
80
0.2
0.4
0.6
0.8
1.0
1.2
100
e
max
e
min
Max and min void ratio,
e
max
and
e
min
Amount of M sand (%)
Figure 6. Relationships between no. of loading cycles and settlement
after tie tamping application
Figure 7 shows the results of settlement at 100
th
loading cycle,
S
100
vs. %sand for all the tests and clearly indicates how PSDs
affect settlement both before and after tie tamping application.
The relationship is quite similar to
e
max
and
e
min
relationships
with % sand (Figure 3).
The relationships between no. of loading cycles,
N
and sleeper
settlement,
S
were obtained using Eq. 1 (Sekine et al., 2005),
100 loading cycles
Lift the sleeper by
Inserting
tie tamper and filling the gap
by moving it laterally
100 loading cycles
N=100
N=10
Tie tamper
Tie tamper
100 loading cycles
N=100
Ballast
Sleeper
p
=120kPa
p
=120kPa
N
e c S
N
1
(1)
where
c
and
represent the initial settlement process, and
represents the process of residual settlement. The relationships
for fresh ballast (i.e., gravel) and 30% sand cases are shown in
Figure 8.


