1296
Proceedings of the 18
th
International Conference on Soil Mechanics and Geotechnical Engineering, Paris 2013
(cohesive layers), were performed on samples from the different
soil layers. In order to determine the strength properties of the
second sand layer isotropically consolidated drained triaxial
tests were performed. The samples were prepared in the
laboratory at relative densities of 40%, 60% and 80%. The in
situ relative density was determined from the CPT’s from the
correlation deduced by Baldi (Lunne, 1997), and turned out to
be approximately 70% for this sand stratum. The characteristic
strength properties were determined from statistical analyses on
the results from the triaxial tests. For the effective angle of
shearing resistance of the sand below foundation level a
representative value of 33° was determined at higher axial strain
levels, which corresponded well with the cone resistance as can
be found in literature, e.g. in the Dutch Code (NEN-EN 1997-1,
2005).
Since deformations of the deep clay layer were expected to
have a relatively large influence on the superstructure,
additional oedometer tests were performed on samples from the
deep clay layer. From experience in the area, it is known that
this layer is overconsolidated, which was confirmed by the CPT
results. However, the overconsolidation ratio (OCR) could not
be accurately determined from the oedometer tests, most likely
due to relaxation of the samples. Therefore the OCR is
determined from the following correlation with the cone
resistance (Lunne, 1997):
v
v
c
ncu
ocu
q
c
c
OCR
' 3.0
17/
;
;
(1)
In which:
OCR = overconsolidation ratio [-]
c
u;oc
= in situ (overconsolidated) undrained shear
strength [kPa]
c
u;nc
= normally consolidated shear strength [kPa]
q
c
= cone resistance [kPa]
σ
v
= vertical total stress [kPa]
σ’
v
= vertical effective stress [kPa]
The calculated OCR corresponded well with experience
from other projects in the area and geological information.
The virgin stiffness and unloading/reloading stiffness was
determined from the oedometer tests, which included an
unloading/reloading step. The determination of these stiffness
parameters from the laboratory tests was expected to be reliable,
since these were determined beyond the preconsolidation stress,
so relaxation effects are expected to be minimal.
Based on the soil investigation and laboratory tests,
representative values for the soil stiffness’s were determined. A
representative elasticity modulus (E
oed;ref
) of approximately 40
MPa and 3.5 MPa was determined for respectively the 1st sand
and deep clay layer. This is the oedometer stiffness at a
reference vertical effective stress of 100 kPa. For the stress-
stiffness relationship a power law was adopted (Brinkgreve,
2011), with a power 1.0 for sand and 0.8 for the stiff clay
(based on oedemeter tests). An unloading/reloading oedometer
stiffness ratio of 4 is applied.
3
DETERMINISTIC DEFORMATION ANALYSIS
During the design process it was recognised that
deformations of the foundation have a large influence on the
design and construction of the superstructure, especially for the
mechanical and structural design. Due to the large ratio between
the height of the pylons and the width of the foundation, a small
rotation of the foundation base results in a large deflection of
the pylon heads. This effect has a significant influence on the
design of the superstructure. In order to determine safe
tolerances which have to be taken into account by the other
design disciplines, a thorough deformation analysis was
performed.
First step in the deformation analysis was to perform ‘best
estimate’ deformation calculations. In the early design stages
analytical 2D settlement calculations were performed. In the
detailed design phase additional 3D FEM calculations were
performed. The software program Plaxis was used for these
calculations.
In the calculations the Hardening Soil (HS) model is used for
the deep clay layer. Aspects of this model include:
- Stress dependent stiffness of the soil
- Plastic straining due to primary deviatoric loading
- Plastic straining due to primary compression
- Elastic unloading/reloading
- Failure according to the MC criterion
The Hardening Soil model does not take creep effects into
account. However, from the laboratory tests it turned out that
about 80% of the settlements are primary and only 20% of the
settlements are related to secondary compression. Therefore the
choice was made to consider the creep effect separately, instead
of applying a soft soil creep model. Soft soil creep models are
especially useful if the influence of creep is more pronounced.
For the sand layers underneath the foundation surface the
Hardening Soil Small-Strain Stiffness (HSSmall) model is used.
This model is similar to the HS model, but additionally takes
the higher stiffness of the soil at small strain levels into account.
For the clayey sand layer above the foundation layer, also the
Hardening Soil (HS) model is used.
The serviceability limit state (SLS) foundation pressures for
the different main piers are in the range between 500 to 700
kPa. The calculated ‘best estimate’ final settlements of the
foundation footings range from 0.10 to 0.25 m. For the rotations
maximum values in the order of 1/1000 were calculated. These
calculated rotations are mainly the result of the bending
moments loads, rather than soil heterogeneity.
In general, soil deformations are difficult to predict
accurately, since various uncertainties can be present. See for
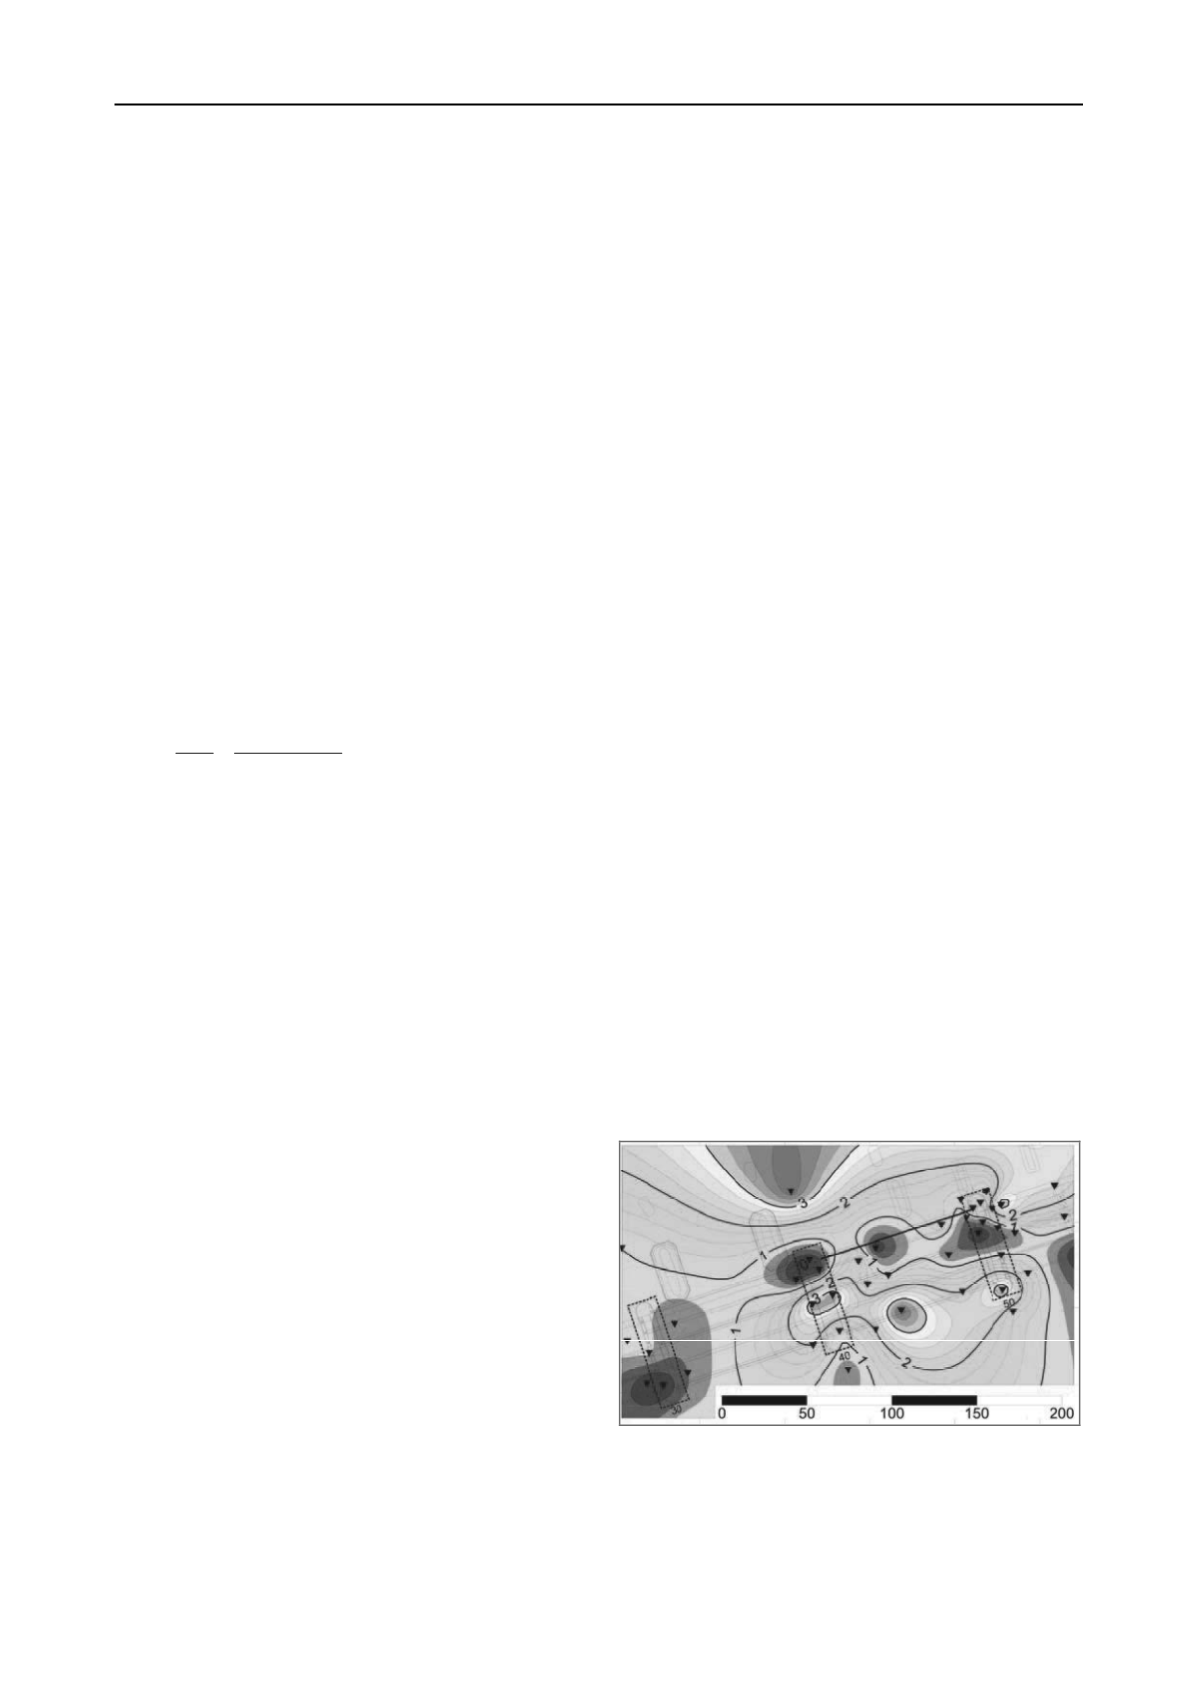
instance Figure 2 where the thickness of the deep (Kedichem)
clay layer is plotted over the footprint of the main bridge piers.
The variation is based on factual data from CPT’s and boreholes
with interpolation between these data.
Figure 2. Thickness Kedichem clay layer [m]
To get a better understanding with regard to subsoil
uncertainties, a sensitivity analysis with the 3D FEM model was
performed. The influence of variations in OCR, (virgin)
stiffness and the thickness of the deep Kedichem clay layer
between the soil investigation points were considered.


