1297
Technical Committee 202 /
Comité technique 202
From the sensitivity analysis it was concluded that the
variation in calculated average settlement was about 25% for
the different subsoil scenarios. The variation in the calculated
rotations was small. The calculated absolute rotations of the
piers were still in the range of 1/1000.
4
PROBABILISTIC DEFORMATION ANALYSIS
The sensitivity analysis with the 3D FEM results in a better
understanding in the range of settlements which could be
expected. However, the variation of soil properties within one
homogeneous soil layer is hardly taken into account in standard
3D FEM calculations. Since this effect can have a large
influence on the rotations of the foundation, a practical
stochastic subsoil model was set up to take this effect into
account.
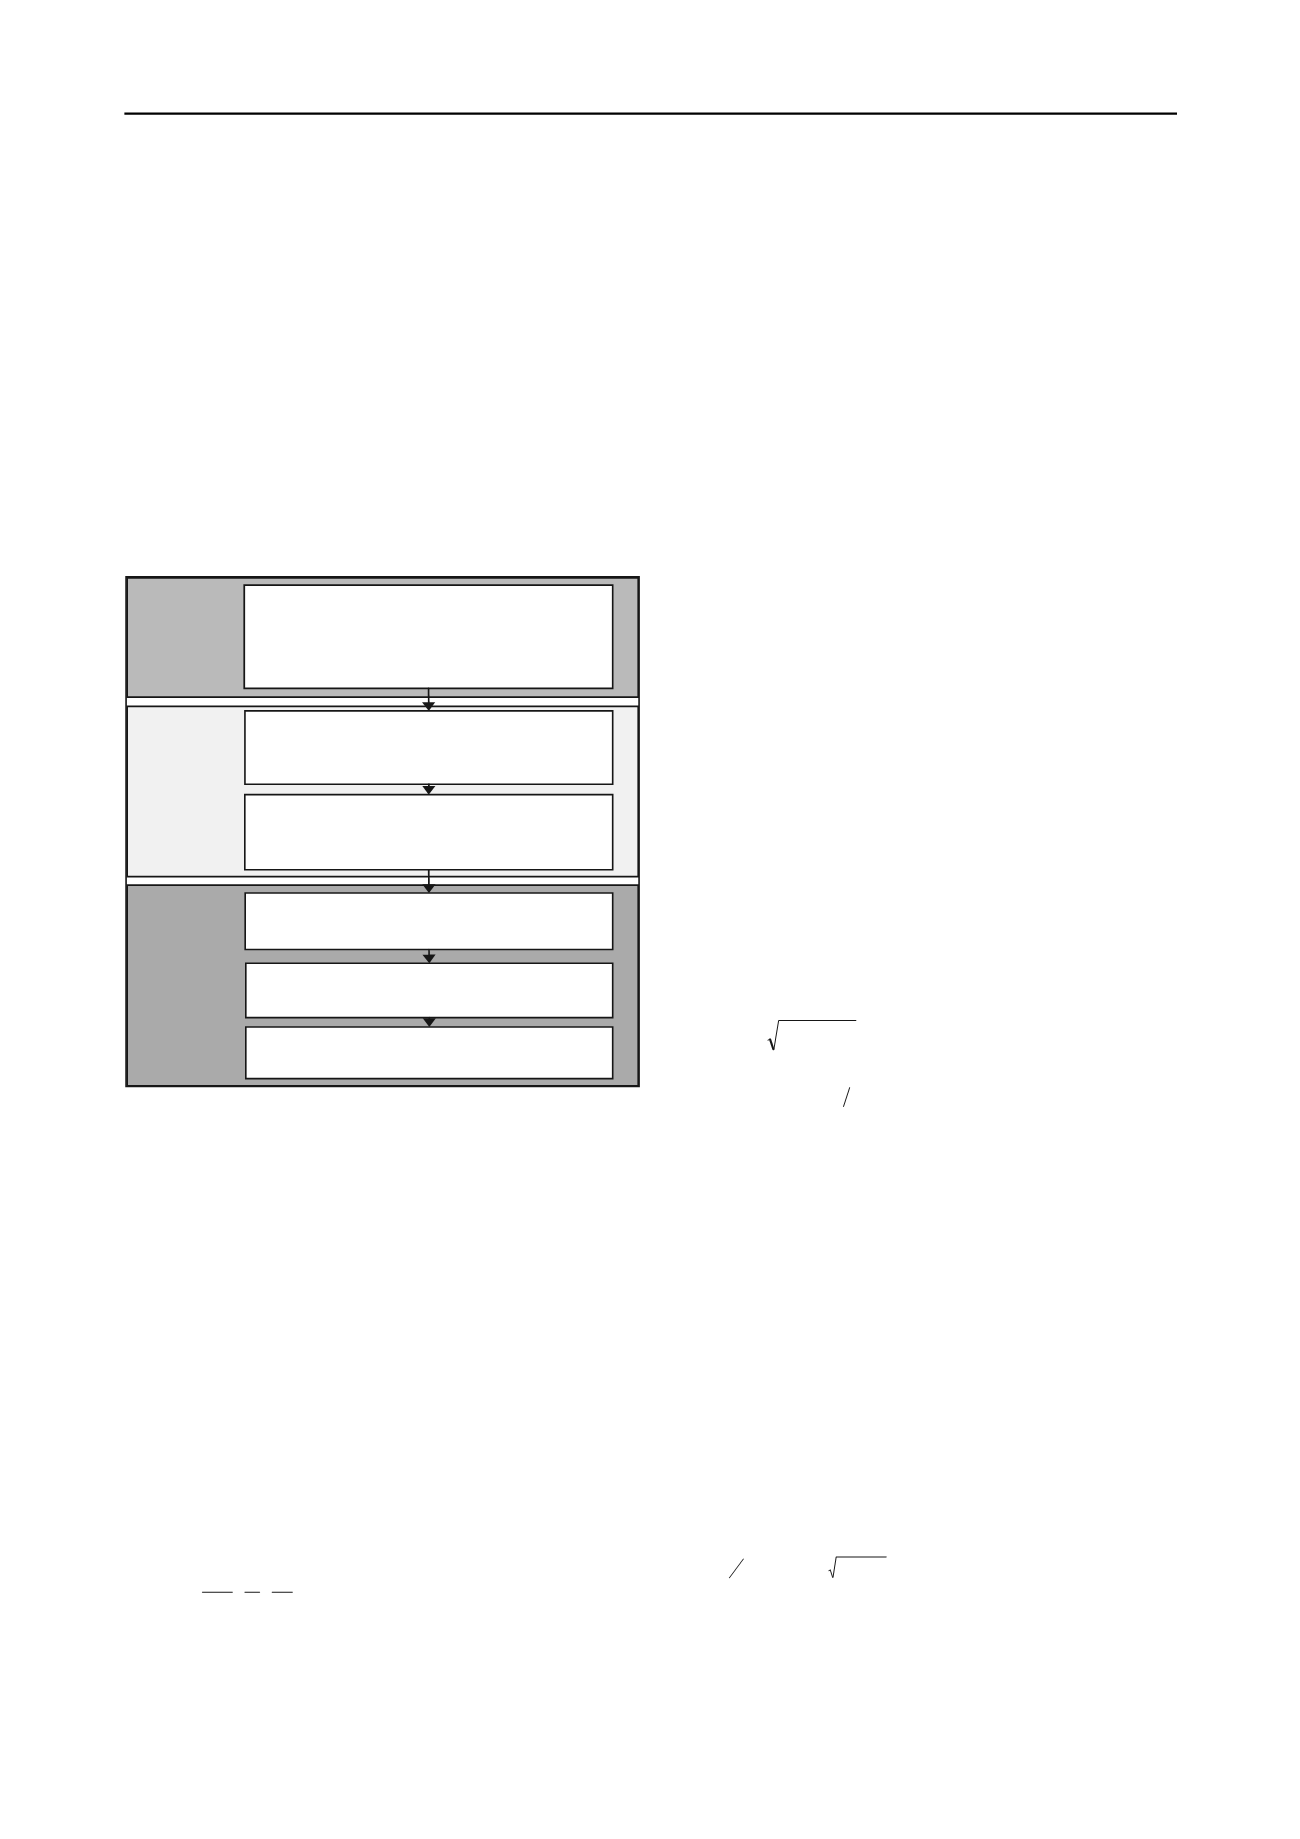
Figure 3. Description of probabilistic model
With this probabilistic model it was possible to determine
the probability of exceedance of a certain design rotation. With
this model it was also possible to perform a quantitative risk
analysis, regarding the effects of foundation rotations. The
model is described section 3.1 to 3.6 and schematically
presented in Figure 3.
4.1
Step 1 - Soil-structure interaction
The foundation is modelled as an infinitely stiff foundation
block, supported by linear elastic (stochastic) springs at a
spacing of about 3 m. Since the foundation consists of a
massive concrete block with a thickness of about 20 m the
assumption of a stiff foundation is considered reasonable.
The linear elastic soil springs are stochastic, representing the
uncertainty in soil behaviour. The stochastic (correlated)
stiffness
k
i;j
of the springs
S
i;j
under the foundation is
determined according to:
J
W
I
L
z
q k
ji
ji
,
.
(2)
In which:
q
=
uniform distributed foundation load, P
z
/(L·W)
[kN/m
2
]
z
i;j
= settlement at location (x
i;j
;y
i;j
) [m]
L
= length of the foundation [m]
W
= width of the foundation [m]
I
=
number of equally spaced springs along the length
of the foundation [-]
J
=
number of equally spaced springs along the width of
the foundation [-]
P
z
=
Vertical foundation load [kN]
All parameters in eq. (2) are deterministic, except for the
settlements. A linear transformation between the probability
density function (PDF) of the settlements (see section 4.3) and
the soil stiffness is applied.
4.2
Step 2 - Settlements
For the determination of the expected value of the (residual)
settlements the results of the 3D FEM model are used. Since the
soil stiffness is primarily a soil property, the influence of the
stiff foundation should not be taken into account in the
determination of the settlements. Therefore the stiffness of the
foundation block is neglected for these settlement calculations,
by using a flexible footing in the 3D FEM model. The
settlements are calculated with a uniform load on the foundation
surface.
4.3
Step 3 – Parameters probability density function
4.3.1
Model parameters
The settlements are modelled as random variables with a
lognormal distribution. The lognormal distribution is often used
to model non-negative random variables, such as thickness of
layers and soil properties. The calculation results from 3D FEM
model are interpreted as the expected value
z
of the PDF of the
settlements.
The parameters of the lognormal distribution of the
settlements has the following parameters (i.e. Fenton and
Griffiths, 2008):
)
1ln(
2
) ln(
z
z
V
(3)
2
) ln(
) ln(
21 )
ln(
z
z
z
(4)
The coefficient of variation of the settlements is based on the
assumption of 30% inaccuracy in the settlement calculations.
That means that there is a probability of about 5% that the
settlements will be 30% larger than the calculated average
settlements. This is a generally applied rule of thumb in the
Netherlands. So:
z
z
3.1
%95
(5)
Based on the lognormal distribution the z
95%
can estimated
by:
)
65.1
(
%95
) ln(
) ln(
z
z
e
z
(6)
Equating eq. (5) and (6) in combination with eq. (3) and (4)
the coefficient of variation (
V
z
) of the PDF of the settlements
can be estimated by:
3.1
)
1 ln(
65.1 )
1 ln( 2
1
2
2
z
z
V
V
e
e
(7)
Eq. (7) results in a coefficient of variation
V
z
of
approximately 0.17.
4.3.2
Correlation parameters
Due to its natural fabric, the soil properties, can be
considered as spatially correlated. Different autocorrelation
Step 4
: Create n correlated realisations of a set
of spring values
Step 5:
Determine for every set of spring
values the rotation of the foundation block
Step 6:
Estimate the probability of
exceedance of a certain rotation
Monte Carlo
simulation
Step 1:
Create a model for the soil-structure
interaction. In this case: infinitely stiff foundation
block, supported by linear elastic (stochastic)
springs
Soil-
structure
interaction
model
Step 2:
Determine expected value of the
settlements under the foundation surface with an
advanced 3D FEM model
Step 3:
Determine the parameters for the PDF
of the settlements and corresponding spring
values for the soil-structure model
Geotechnical
input


