1289
Technical Committee 202 /
Comité technique 202
kPa. In the saturated condition (
w
=14.3%), a saturated specimen
after compaction (
D
c
=95%) and permeation was isotropically
consolidated under
σ
c
'
of 49.0 kPa. In the unsaturated condition
(
w
=5.3%), first, after compaction (
D
c
=95%) and permeation, a
capillary-saturated specimen was isotropically consolidated
under a net normal stress (
σ
net
) of 49.0 kPa by applying
confining pressure (
σ
c
) of 249 kPa, pore air pressure (
u
a
) of 200
kPa and pore water pressure (
u
w
) of 200 kPa. Here,
σ
net
is
defined as
σ
net
=
σ
c
u
a
. Next, an unsaturated specimen under a
matric suction (
s
) of 10 kPa was produced by decreasing
u
w
while keeping both
σ
c
and
u
a
constant. Here,
s
is defined as
s
=
u
a
u
w
. Upon attaining an equilibrium condition in the
consolidation process, MR tests were performed under fully
drained condition (CD test) as follows. For repeated loading, a
haversine-shaped load pulse with a load duration of 0.1 sec
followed by a rest period of 0.9 sec was applied. A MR test
requires both conditioning process with 1000 loading cycles
(
N
c
) followed by actual testing process with 100 loading cycles
under 15 successive paths with varying combinations of
confining pressure and deviator stress.
4 RESULTS AND DISCUSSIONS
4.1
Results of freeze-thaw CBR tests
The frost heave rate (
U
h
), which is used as a frost-susceptibility
index, was
U
h
=0.1mm/h or lower for all test conditions, and
thus frost-susceptibility of C-40 is considered to be low
regardless of the freeze-thaw history and the soil water content.
Whereas, Figure 4 shows the relationships between CBR and
initial volumetric water content (
θ
) under different
N
f
. The
overall tendency shows a decrease in CBR caused by the
increase in water content. Comparing test results of specimens
without freezing (
N
f
=0) to examine differences due only to
water content, CBR is found to decrease to nearly 50% when
the condition changes from air-dried to saturated, indicating that
the water content has an extremely major influence on CBR. On
the other hand, a drop in CBR accompanied by an increase in
the number of
N
f
is observed regardless of the water content. In
particular, the ratio of decreasing CBR tends to become larger
with the decrease in the water content. The volumetric water
content at the subbase course in an actual pavement structure is
lower than that of the specimen in wet condition (Ishikawa et al.
2012). Thus, it is expected that the influence of the freeze-thaw
action on the bearing-capacity of granular base course materials
is more pronounced in in-situ condition.
4.2
Results of resilient modulus tests
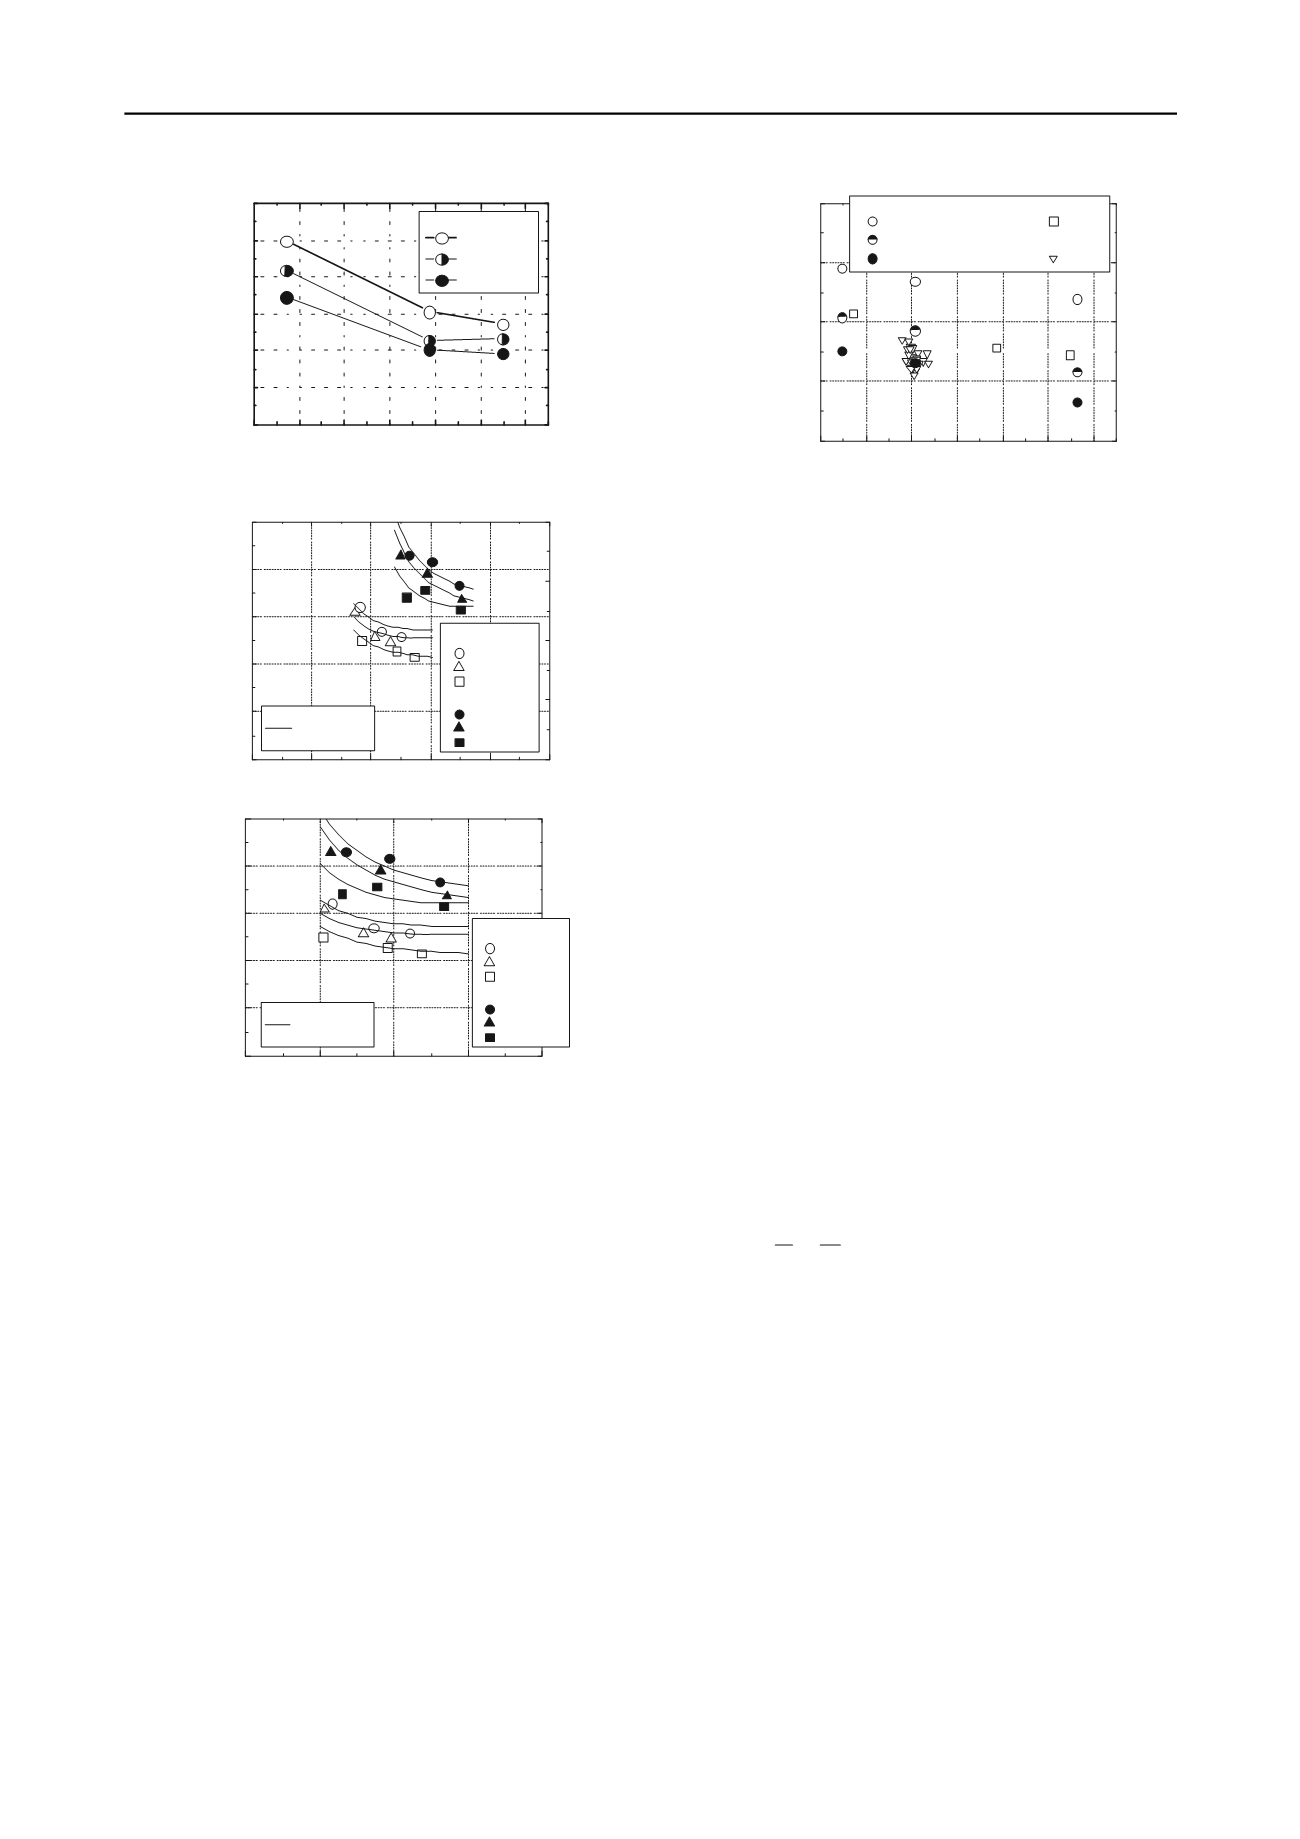
Figure 5 shows the relationships between the resilient modulus
(
M
r
) and the effective mean principal stress (
p’
) or the deviator
stress (
q
), respectively, obtained from MR tests on C-40 under
different water contents. Here,
M
r
is defined as
q
cyclic
/
ε
r
(
q
cyclic
:
amplitude of repeated axial stress,
ε
r
: amplitude of resultant
recoverable axial strain due to
q
cyclic
). Note that the test data in
unsaturated condition was arranged by using
σ
net
instead of
σ
c
'
in air-dried and saturated conditions. Besides, the regression
analysis results of Eq. 1, which is utilized as a resilient modulus
constitutive equation in the MEPDG (AASHTO 2008), are also
shown in the figure.
2
3
1
1
k
k
ii
oct
r
a
a
a
M k p
p p
(Yan and Quintus 2002)
(1)
Where,
k
1
,
k
2
,
k
3
are regression constants,
σ
ii
is bulk stress,
p
a
is
normalizing stress, and
τ
oct
is octahedral shear stress. For plots
with the same
σ
c
'
,
M
r
decreases with the increase in
p’
and
q
,
while for plots with the same
p’
and
q
,
M
r
increases with the
increase in
σ
c
'
. A dominant effect for the deformation behavior
of C-40 is an increase in
M
r
with increasing confining pressure,
regardless of water content. On the other hand, when comparing
plots with the same
p’
and
q
under the same
σ
c
'
, the remarkable
decreasing tendency of
M
r
followed by the increase in the water
content is recognized irrespective of
σ
c
'
. The stress-dependency
of
M
r
obtained from this research qualitatively agrees well with
the tendency of past researches like the regression analysis by
Eq. 1, regardless of the water content.
4.3
Effects of freeze-thaw and water content on M
r
Under different water contents, Figure 6 compares the resilient
modulus (
M
r(CBR)
) estimated by the following empirical formula
(Eq. 2) based on the correlation between CBR and
M
r
, with the
resilient modulus (
M
r(MR)
) derived from the regression analysis
results as shown in Figure 5. Note that
M
r(MR)
are estimated by
assuming the stress state, calculated using multi-layered elastic
0 5 10 15 20 25 30
0
10
20
30
40
50
60
C-40
:
N
f
= 0 cycle
:
N
f
= 1 cycle
:
N
f
= 2 cycles
CBR
(%)
Volumetric water content,
Figure 4. Results of freeze-thaw CBR tests.
0
20 40 60 80 1
0
100
200
300
400
500
0 5 10 15 20 25 30
0
100
200
300
400
MR test (
'
1
/
'
3
=4): CBR test:
:
M
r(MR)
at
'
c
=20.7kPa
:
M
r(CBR)
:
M
r(MR)
at
'
c
=10.0kPa FWD test:
:
M
r(MR)
at
'
c
= 5.0kPa
:
E
2(FWD)
Resilient modulus,
M
r
(MPa)
Volumetric water content,
Figure 6. Influence of water content on resilient modulus.
00
MR-1 toMR-6
:Approximation
curve byEq. 1
'
c
=20.7kPa
: Air-dried
: Unsaturated
: Saturated
'
c
=34.5kPa
: Air-dried
: Unsaturated
: Saturated
Resilient modulus,
M
r
(MPa)
Effective mean principal stress,
p'
(kPa)
(a)
0
40
80
120
160
0
100
200
300
400
500
MR-1 toMR-6
:Approximation
curve by Eq. 1
Resilient modulus,
M
r
(MPa)
Deviator stress,
q
(kPa)
(b)
'
c
=20.7kPa
: Air-dried
: Unsaturated
: Saturated
'
c
=34.5kPa
: Air-dried
: Unsaturated
: Saturated
Figure 5. Results of resilient modulus tests.


