1311
Technical Committee 202 /
Comité technique 202
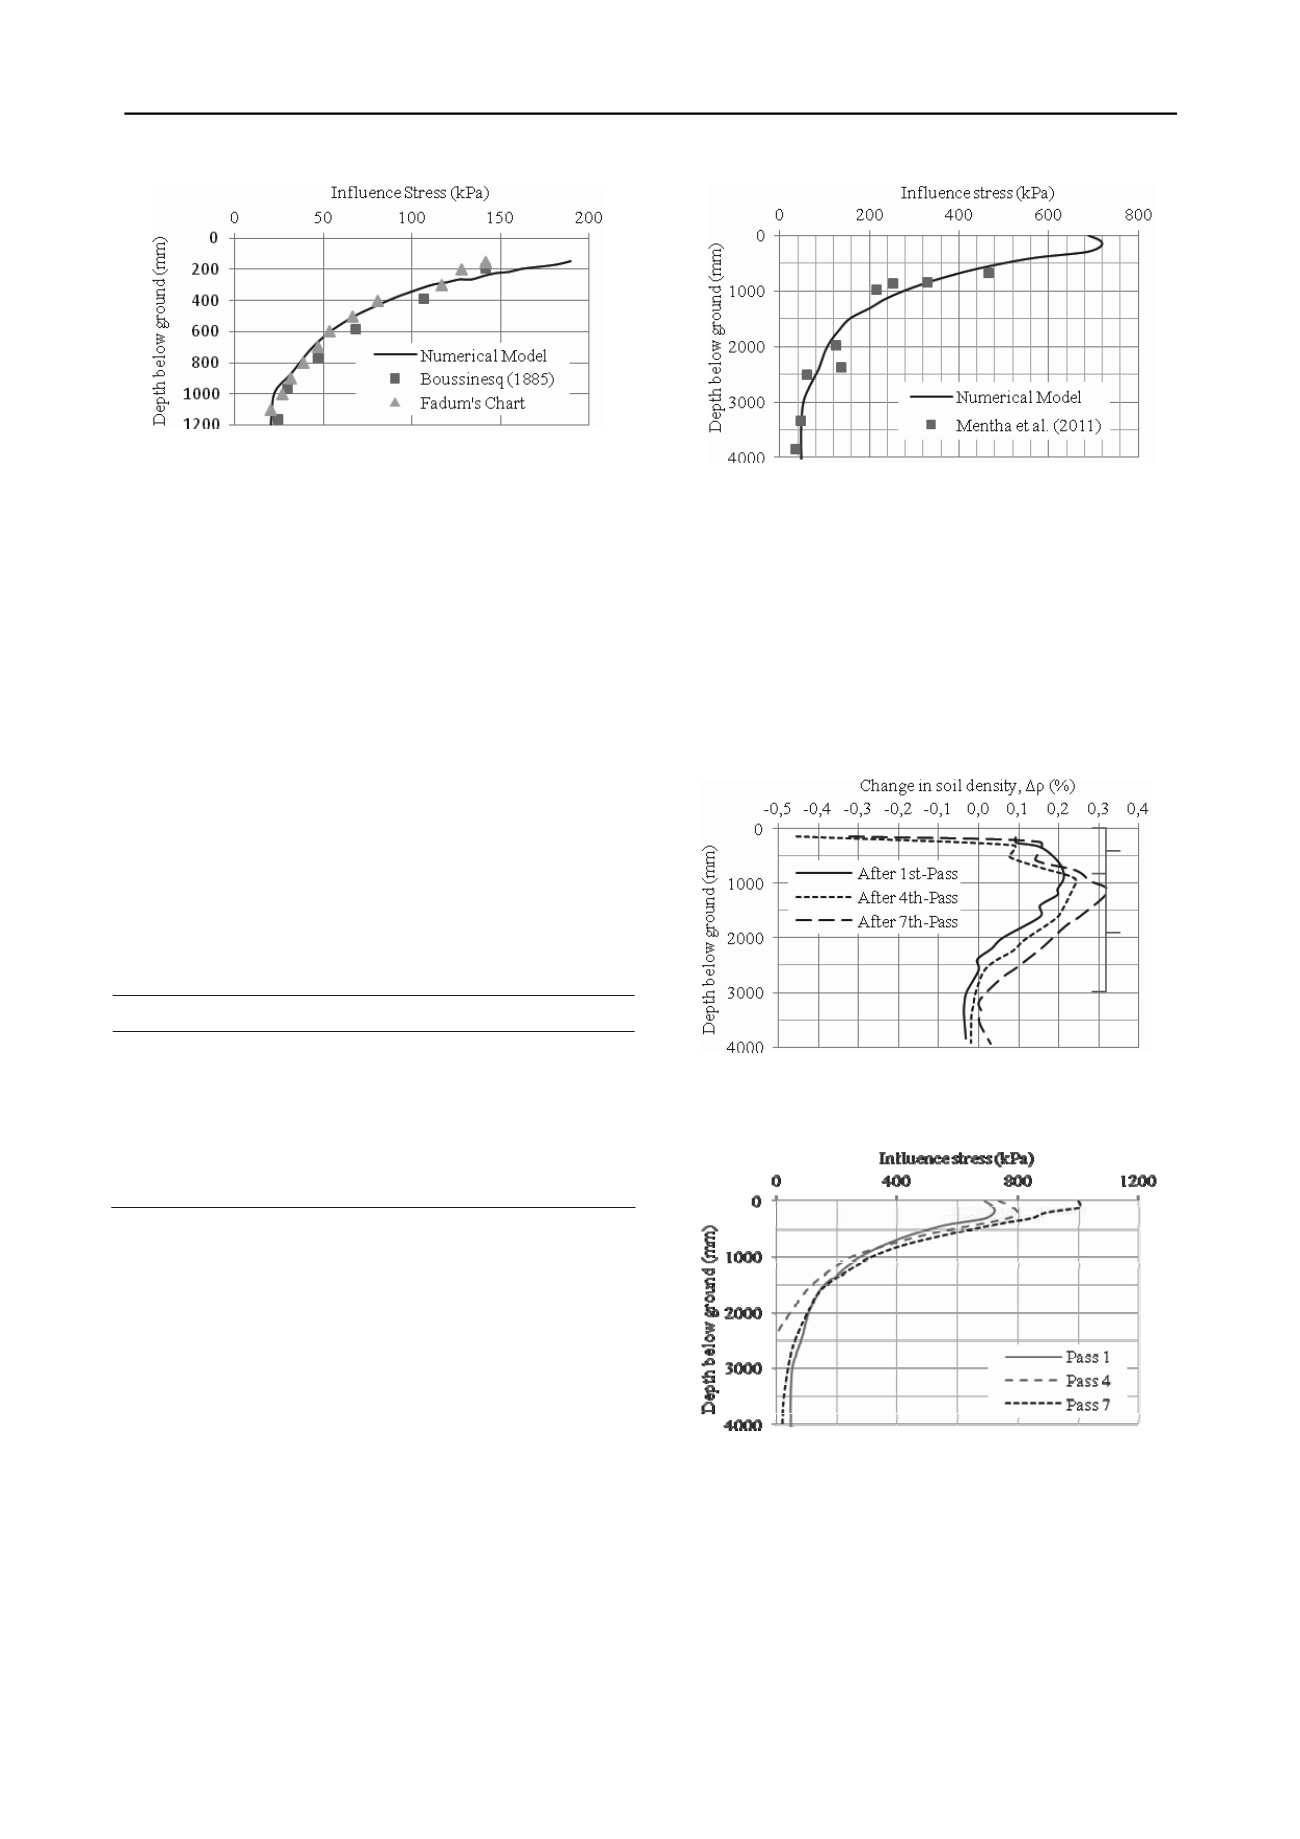
Figure 3. Validation of FEM model – static case.
5 RESULTS OF NUMERICAL MODELING
Some of the key results of a single pass are summarized in
Table 2. In order to quantify the effectiveness of the impact
roller on certain soils and specific site conditions, there is a need
to distinguish between the
depth of influence zone
(or
influence
depth
in short) and
improvement depth
. The traditional
definition of
depth of influence zone
refers to the depth of soil
affected by the load imposed at the ground surface; generally
using 10% of the peak stress as a limit. On the other hand, the
improvement depth
is the depth over which the soil undergoes
significant improvement in density and shear strength due to
RDC, as illustrated in Figure 5. Improvement depth is, in the
authors’ opinion, a more appropriate measure of the
effectiveness of the impact roller, as it is a function of soil type,
site characteristics and the weight and operating speed of the
RDC module. The results indicate that the influence depth is
not equal to the improvement depth, as the low influence stress
at greater depths may only cause soil to deform elastically,
resulting in no change (or improvement) in soil density upon
load removal.
Table 2. Summary of a single pass of the impact roller.
Parameters
Single pass
Peak stress (kPa)
720
Settlement (mm)
18
Influence depth (mm)
2,640
Maximum density change (%)
0.2
Improvement depth (mm)
2,350
Figure 5 shows the change in soil density varying with depth for
both single and multiple passes of the impact roller. The
positive change implies that density of the soil increased and the
volume decreased. On the other hand, a negative change
indicates decreased density and a volume increase. A few
curious trends are observed in Figure 5. Firstly, the density of
the soil is found to decrease within 200 to 250 mm of the
ground surface. Kim (2011) found similar results, where the
near surface soils actually become looser due to RDC. This is
further confirmed by visual inspection of the surficial soil which
is disturbed and loosened as a result of RDC where the soil is
displaced laterally by the module rather than compacted.
Additionally, the depth where the maximum density change is
observed (~900 to 1,150 mm) does not correspond to the depth
where peak influence stress occurs (~200 mm), as shown in
Figure 5. This indicates that the compaction for the top layer of
soil is inefficient; a higher influence stress does not necessarily
result in an increased density. Furthermore, the depths and the
magnitude of the peaks increase with the number of passes.
Figure 4. Validation of FEM model – dynamic case.
Figure 6 shows the relationship between influence stress and
depth with the number of RDC passes, and Figure 7 shows the
in situ stress measured in the field using the EPCs. It is evident
from these figures that there is an upward trend of peak
influence stress as the number of passes increases. This upward
trend is expected, as the force imparted by the roller causes the
void ratio of the soil to decrease, resulting in increased soil
density and surface settlement. With increased density, the
pressure wave can more readily propagate to deeper layers,
resulting in increased pressures.
Inconclusive
Effective
Depth
Figure 5. FEM predicted change in soil density versus depth after single
and multiple passes.
Figure 6. Influence stress versus depth for single and multiple passes.
Mentha et al. (2011) used SASW, in conjunction with
dynamic cone penetration tests, to assess the same location at
intervals of eight passes of the impact roller. Typical SASW
results are shown in Figure 8, where it can be observed that
increased number of passes results in a noticeable increase in
shear modulus between depths of 0.5 to 2.1 m. This is an
indication of increased soil density. Similar behavior is
observed in the FEM model (Figure 5) between depths of 0.8 to
3.0 m. In Figure 8, above a depth of 0.8 m (same 0.8 m in
Figure 5) the results were inconclusive, which is consistent with
conclusions drawn from penetrometer and FEM results. Below


