1310
Proceedings of the 18
th
International Conference on Soil Mechanics and Geotechnical Engineering, Paris 2013
vary considerably, due to inherent differences between sites and
how the magnitude of improvement is both defined and
quantified. For example, Avalle and Carter (2005) reported a
depth of improvement to approximately 1.4 m in botany sands,
whereas Avalle (2007) reported a depth of 7 m in calcareous
sands. Additionally, time and cost constraints typically limit the
number of field tests that can be undertaken. In the case of
Mentha et al. (2011), there were requirements on the minimum
depth from the surface that cells could be placed to avoid
damage to the EPCs, as well as the minimum spacing between
adjacent EPCs to reduce stress shadowing effects. Such
arrangements provide physical limitations on the spatial
resolution of data that can be collected. As a result, contour
plots of vertical and lateral stress produced lack of resolution.
There is currently no employable theoretical model or robust
predictive model to accurately predict the depth of influence of
RDC, the energy imparted per blow or the effectiveness of RDC
on different soil types and site conditions. Moreover, there is
also limited published information from case studies to indicate
the optimal number of passes needed to attain the targeted soil
density for a given site or ground condition. A consequence is
that costly and time consuming field trials are inevitably
required before using RDC. Due to cost and time constraints
this can limit the usage of RDC in some projects.
2 NUMERICAL MODELLING
This research aims to fill the knowledge gap discussed
previously by evaluating the effectiveness of RDC using the
dynamic finite element modeling (FEM) software LS-DYNA
(Hallquist 2006). A 3D numerical model was developed that
allowed the rolling dynamics of the 4-sided impact roller to be
simulated. The model was then validated against field data
collected by Mentha et al. (2011). The adopted final FEM
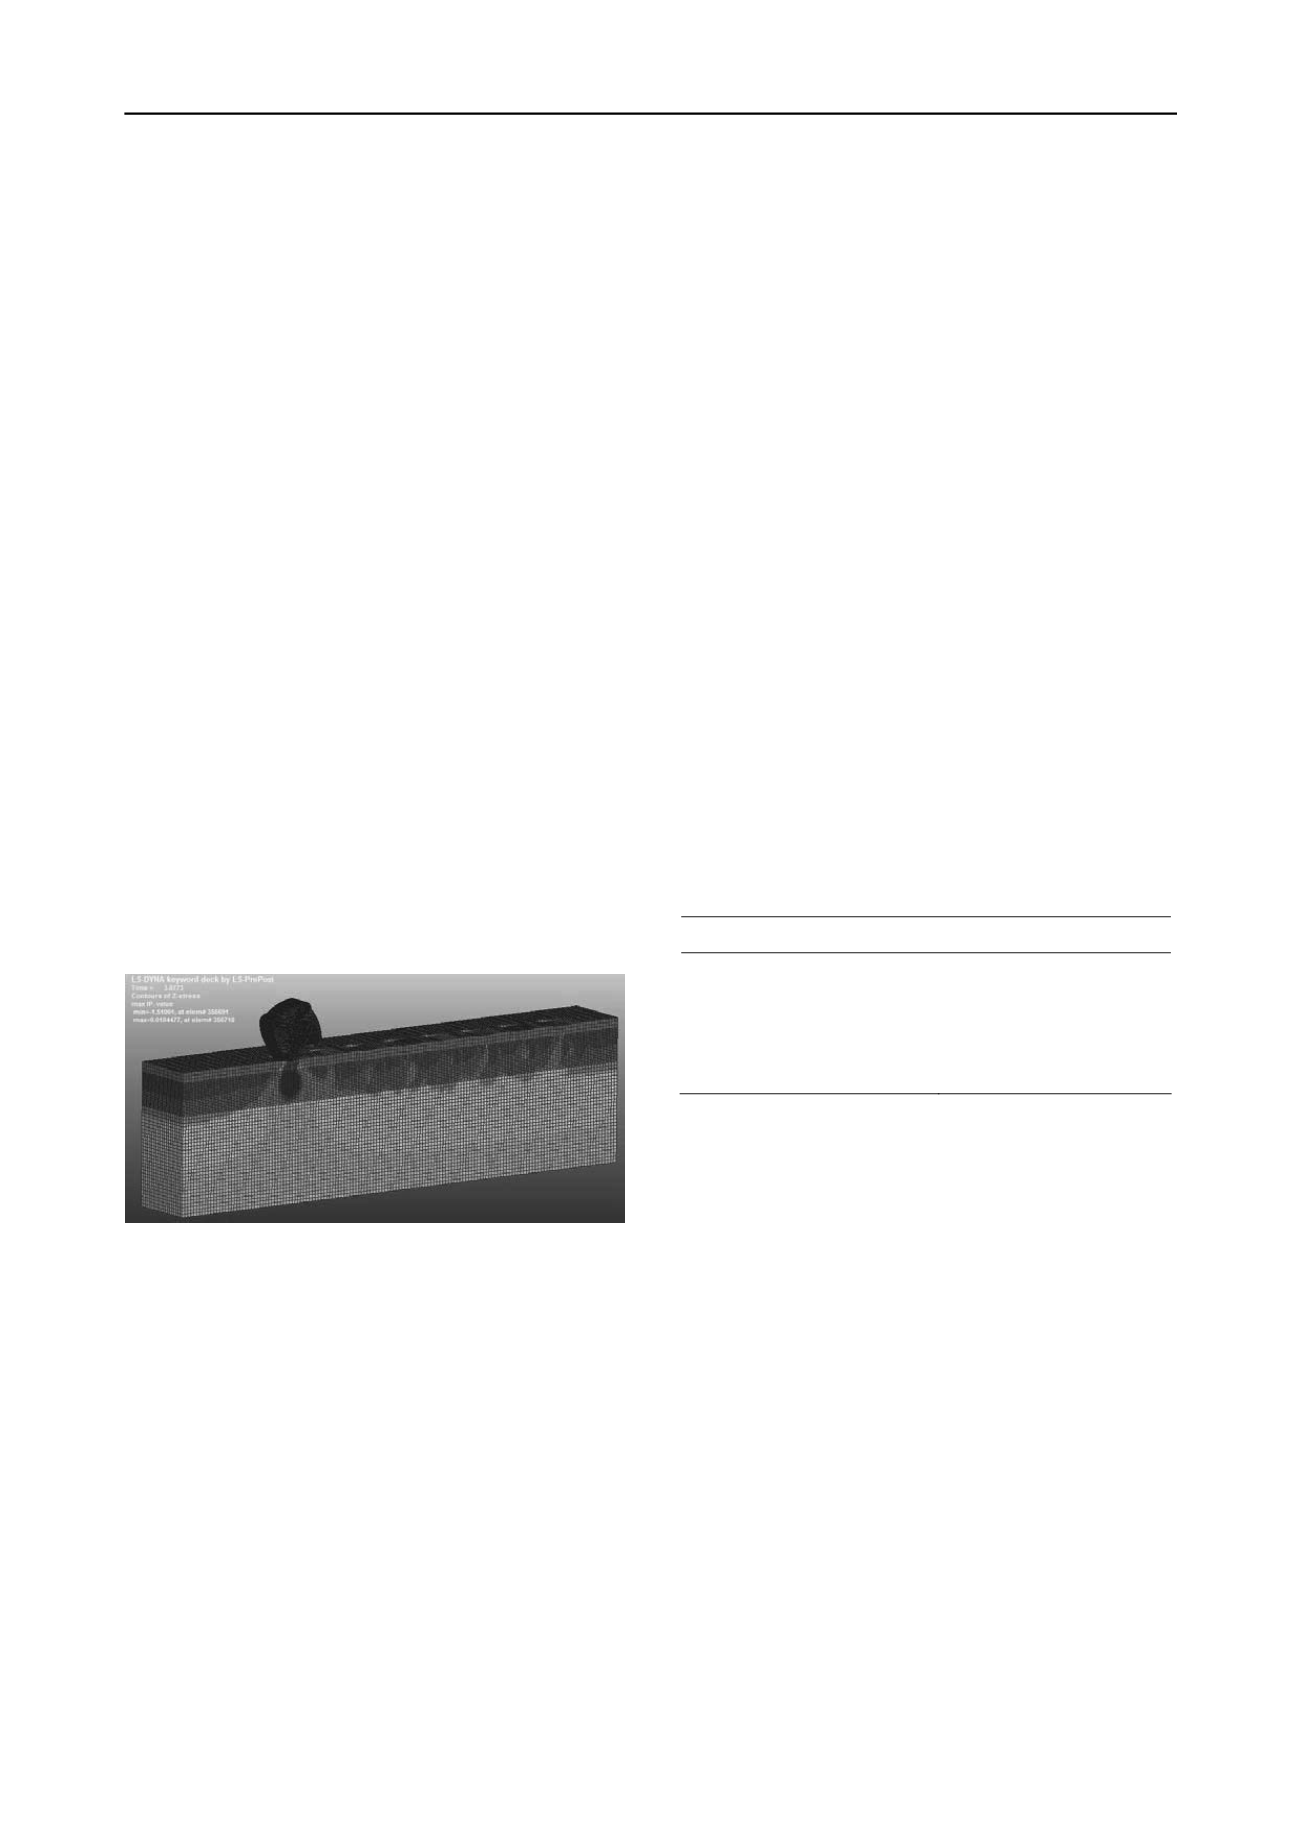
model is illustrated in Figure 2.
Figure 2. FEM model.
The FEM model consisted of two major parts: the 4-sided
impact roller itself, which is a simplified model of the
Broons
BH-1300 roller
(Figure 1), and the soil mass. The module is a
steel encased concrete block. As it rolls, any deformation
caused by the impact on the roller is very small and negligible.
Therefore, it is reasonable to assume that the roller acts as a
rigid body. The model utilized shell elements on the roller,
whilst 8-node quadrilateral solid elements were used on the soil
mass. To simulate the confinement and far field conditions, LS-
DYNA boundary conditions *BOUNDARY_SPC_BIRTH
_DEATH and *BOUNDARY_NON_REFLECTING were
prescribed to the sides and base of the soil mass. Two of LS-
DYNA’s soil constitutive models were examined, namely the
MAT_005_Soil_and_Foam and the MAT_193_Drucker_and_
Prager models. It was found that the MAT_005 underestimated
the soil settlement caused by the roller and was therefore
excluded from further modeling. During the initialization stage
of the modeling, the effects of gravity loading were added using
*LOAD_BODY_Z and *LOAD_RIGID_BODY. The contact
definitions between the roller and the soil mass is described in
LS-DYNA’s *CONTACT_AUTOMATIC_ SURFACE_TO_
SURFACE_ID. Finally, the *BOUNDARY_PRESCRIBED_
MOTION_RIGID option was used to define the rolling motion
(both horizontal and rotational speeds) of the roller. A detailed
description of the FEM is given by Bradley et al. (2012).
3 FIELD WORK AND LABORATORY TESTING
The field work undertaken by Mentha et al. (2011) took place at
the Project Magnet Tailings Storage Facility at the Iron Duke
Mine, South Australia. The fill material typically consisted of
coarse iron magnetite tailings that are a by-product of a
consistent treatment process. The results from sieve analyses
and plasticity tests indicated that the soil is a well graded sand
(SW) with small quantities of gravel-sized material (14%) and
clay fines (6%) of low plasticity (LL = ~22%, PL = ~11%).
The average field moisture content was ~5% and the water table
was located well below the influence depth of RDC.
The test pad consisted of three lanes; three lift heights of
1200 mm were achieved. The EPCs were strategically placed at
various vertical and lateral levels. The EPCs were connected to
a data acquisition system and a laptop to continuously record
the pressures induced by the 8-tonne BH-1300 impact roller.
EPC data for the roller at rest (static case) and in motion
(dynamic case) were analyzed and reported.
Triaxial and direct shear testing was carried out by the
authors to complement the results from Mentha et al. (2011) to
characterize further the engineering properties of the tailings
material. The results for key soil parameters, which are essential
for MAT_193, are summarized in Table 1. The Poisson’s ratio
was assumed to be 0.3. These values were used in the
subsequent numerical modeling.
Table 1. Summary of laboratory test results for key soil parameters.
Soil parameters
Results
Cohesion (kPa)
7
Angle of internal friction (°)
37
Elastic shear modulus (MPa)
5.7
Mass density (t/m
3
)
2.55
4 VALIDATION OF FEM
Validations of the FEM focused on both static and dynamic
(single pass at 10.5 km/hr rolling speed) cases. In the static
case, the variations of influence stress with respect to depth
from the FEM model were compared with solutions derived
from classic Boussinesq theory and Fadum’s chart.
Comparisons are summarized in Figure 3. Note that, the
influence stress plotted is due to the impact roller only;
excluding the overburden pressure due to the soil’s self weight.
Moreover, the FEM predicted an immediate settlement of
4.4 mm, which is very close to the solution given by theoretical
elastic theory of 5.1 mm.
In the dynamic case, the FEM was validated against field
data collected by Mentha et al. (2011), and the results are shown
in Figure 4. The comparison showed that the FEM accurately
predicted the influence stress at various depths and exhibited a
smooth trend. The FEM also predicted an immediate settlement
of 17.8 mm after a single pass. Mentha et al. (2011) reported
settlement data after the 8
th
and 16
th
passes only. In order to
directly compare the results, approximations using linear and
quadratic trend fitting to the field data yielded 17.0 and
18.5 mm respectively for a single pass. The settlement
predictions from the FEM lay between these two values. In
summary, the results showed that the FEM is able to predict
accurately the influence stress and soil settlement in the static
and dynamic cases.


