3465
Technical Committee CFMS /
Comité technique CFMS
shown at the end of the semester but questions are gradually
introduced over the course of the semester shortly after the
corresponding topic has been covered. Nevertheless, the
participation of the students significantly decreases over the
course of the semester.
0
10
20
30
40
50
60
70
80
1
2
3
4
5
Percentage [%]
How would you assess the practicality of computer aided
learning systems in general? 1: useless to 5: excellent
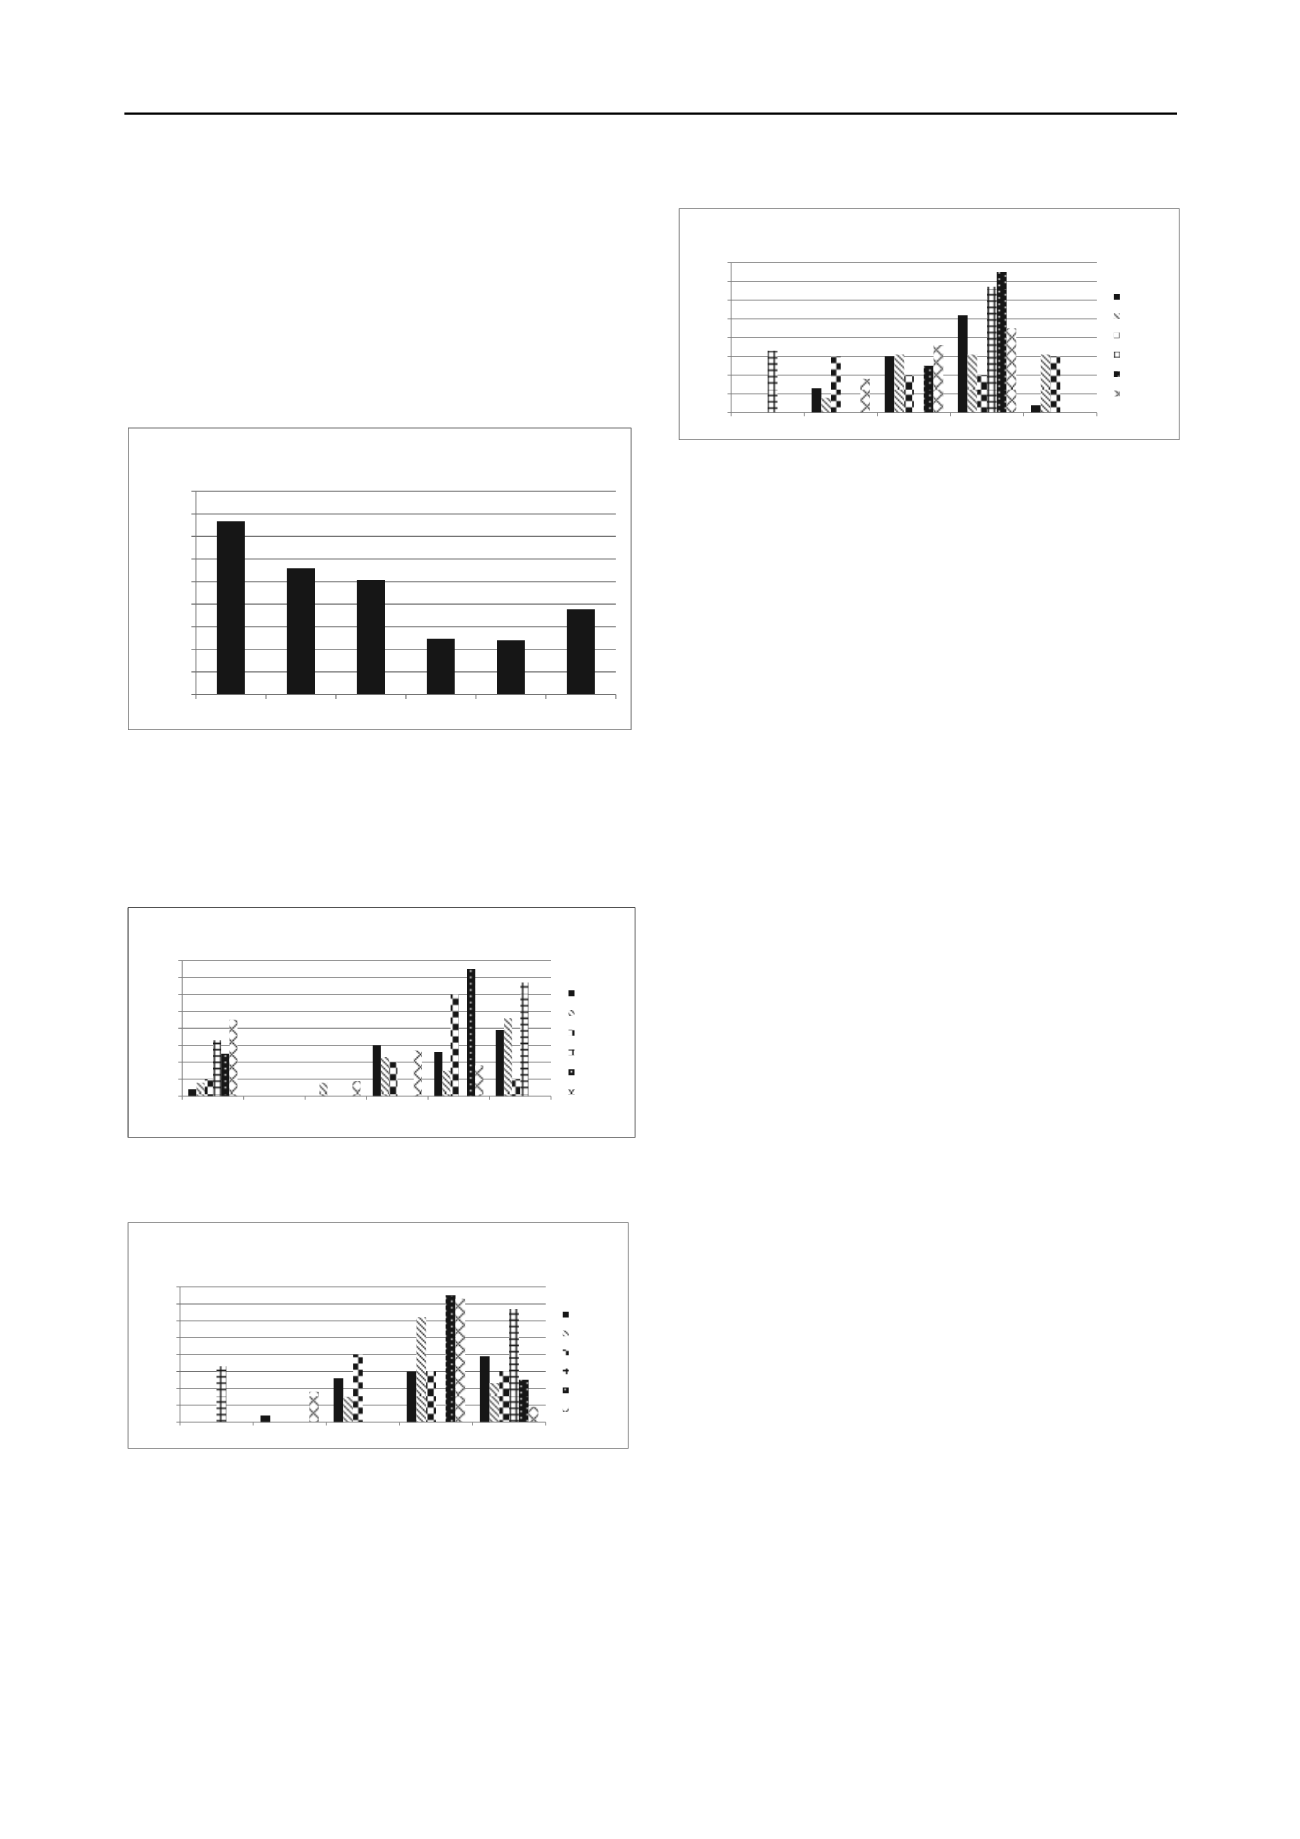
Student participation has also decreased over the years.
While in 2007, the year GEOTip was introduced to the students,
38 % of all possible questions were answered; this percentage
decreased to 12 % in 2011 and then rose again to 19 % in 2012
(see Figure 2).
2007 (23)
2008 (13)
2009 (10)
2010 (3)
2011 (4)
2012 (11)
0
5
10
15
20
25
30
35
40
45
2007
2008
2009
2010
2011
2012
Percentage (%)
Student evaluation of the years: percentage of answered
questions
Figure 5: Development of the assessment of the practicality of computer
aided learning systems over time. The number of answers is given in
parentheses.
3 INNOVATIONS
Figure 3 shows that students generally judge GEOTip to be
better than other computer aided learning systems.
Astonishingly, the number of students without prior experience
of computer aided learning systems increases over the years
since its introduction.
Funding from an ETH Zürich Innovedum grant was received in
August 2011, in order to upgrade the services offered by
GEOTip for students from outside civil engineering, who study
soil mechanics as a part of their course. Work began on a series
of recorded lectures based on a set of mindmaps, which were
designed to introduce basic concepts, and also on a series of
recorded experiments, designed to explain to students and new
staff members how each experiment works and how to use the
equipment within the IGT laboratory. Work also began on
revising and updating the script – a bilingual purpose written
textbook, designed to take students through the course.
Figure 2: Student participation over the years since 2007.
3.1
Recorded lectures
0
10
20
30
40
50
60
70
80
no
experience
much worse worse
equal
better much better
Percentage [%]
How does the GEOTip website do when compared with other computer
aided learning systems?
2007 (23)
2008 (13)
2009 (10)
2010 (3)
2011 (4)
2012 (11)
0
10
20
30
40
50
60
70
80
1
2
3
4
5
Percentage [%]
Assess the visual quality of the GEOTip website as regards design,
picture quality, legibility, and menu organisation. 1: useless to 5:
excellent
2007 (23)
2008 (13)
2009 (10)
2010 (3)
2011 (4)
2012 (11)
In order to reduce time burdens on professors and assistants, a
series of online lectures, based on mindmaps and the online
scripts have been created using a combination of voiceovers
over moving images, taken using screengrab software,
displaying the section of the mindmap, the script or the graphic
being discussed. Each of the 7 lectures is between 1-3 hours
long. Since fundamental but complex issues are covered, it is
pieced together so that single sections may be used as stand-
alone lectures in order to allow students to focus in on one issue
rather than being side-tracked by confronting many topics at
once. The main aim was to give students a method of learning
basic concepts from geotechnical engineering at their own pace,
and allowing them to revisit some of the more complex ideas as
many times as required. “Jump points” embedded both into
videos and corresponding mindmaps allow students to go
straight to a chosen section and revisit the same section on
multiple occasions.
Figure 3: Development of the comparison of GEOTip with other
computer aided learning systems over the years. The number of answers
is given in parentheses.
3.2
Online laboratories
Online laboratories are recorded videos of an assistant
performing many experiments (such as oedometer, Proctor and
plastic index tests) used to produce one of a series of
commonly-used engineering parameters.
The rationale behind the online laboratories was twofold –
firstly it allows bachelors and masters students to learn how data
The GEOTip website is mainly given marks of 4 and 5 out of
5 for design, picture quality, legibility and menu organisation
(Figure 4). It can be seen though that a decreasing number of
students award the mark 5 (excellent) although objectively the
content and design of the website has not changed. This could
be a hint that students’ perception changes with time and that
continuing improvement is needed to keep students’ acceptance
at a high level.
that they will use throughout their career is produced, and what
common inaccuracies and mistakes are. Secondly, it will allow
project students and new members of staff to understand how to
use the equipment in the laboratory, while reducing
commitments for the laboratory manager and technician.
Figure 4: Development of the assessment of the design, picture quality,
legibility and menu organisation over the years. The number of answers
is given in parentheses.
Within the recorded demonstrations explanations of how to
perform the experiment, reasons why the experiment is done in
a particular way, and common mistakes made are embedded
.
The demonstrations are not designed to be watched whole, but
to be used as reference guides, with viewers skipping through
sections and repeating other sections.


