3456
Proceedings of the 18
th
International Conference on Soil Mechanics and Geotechnical Engineering, Paris 2013
changes in the range of 14% to 20% with an average of 15%.
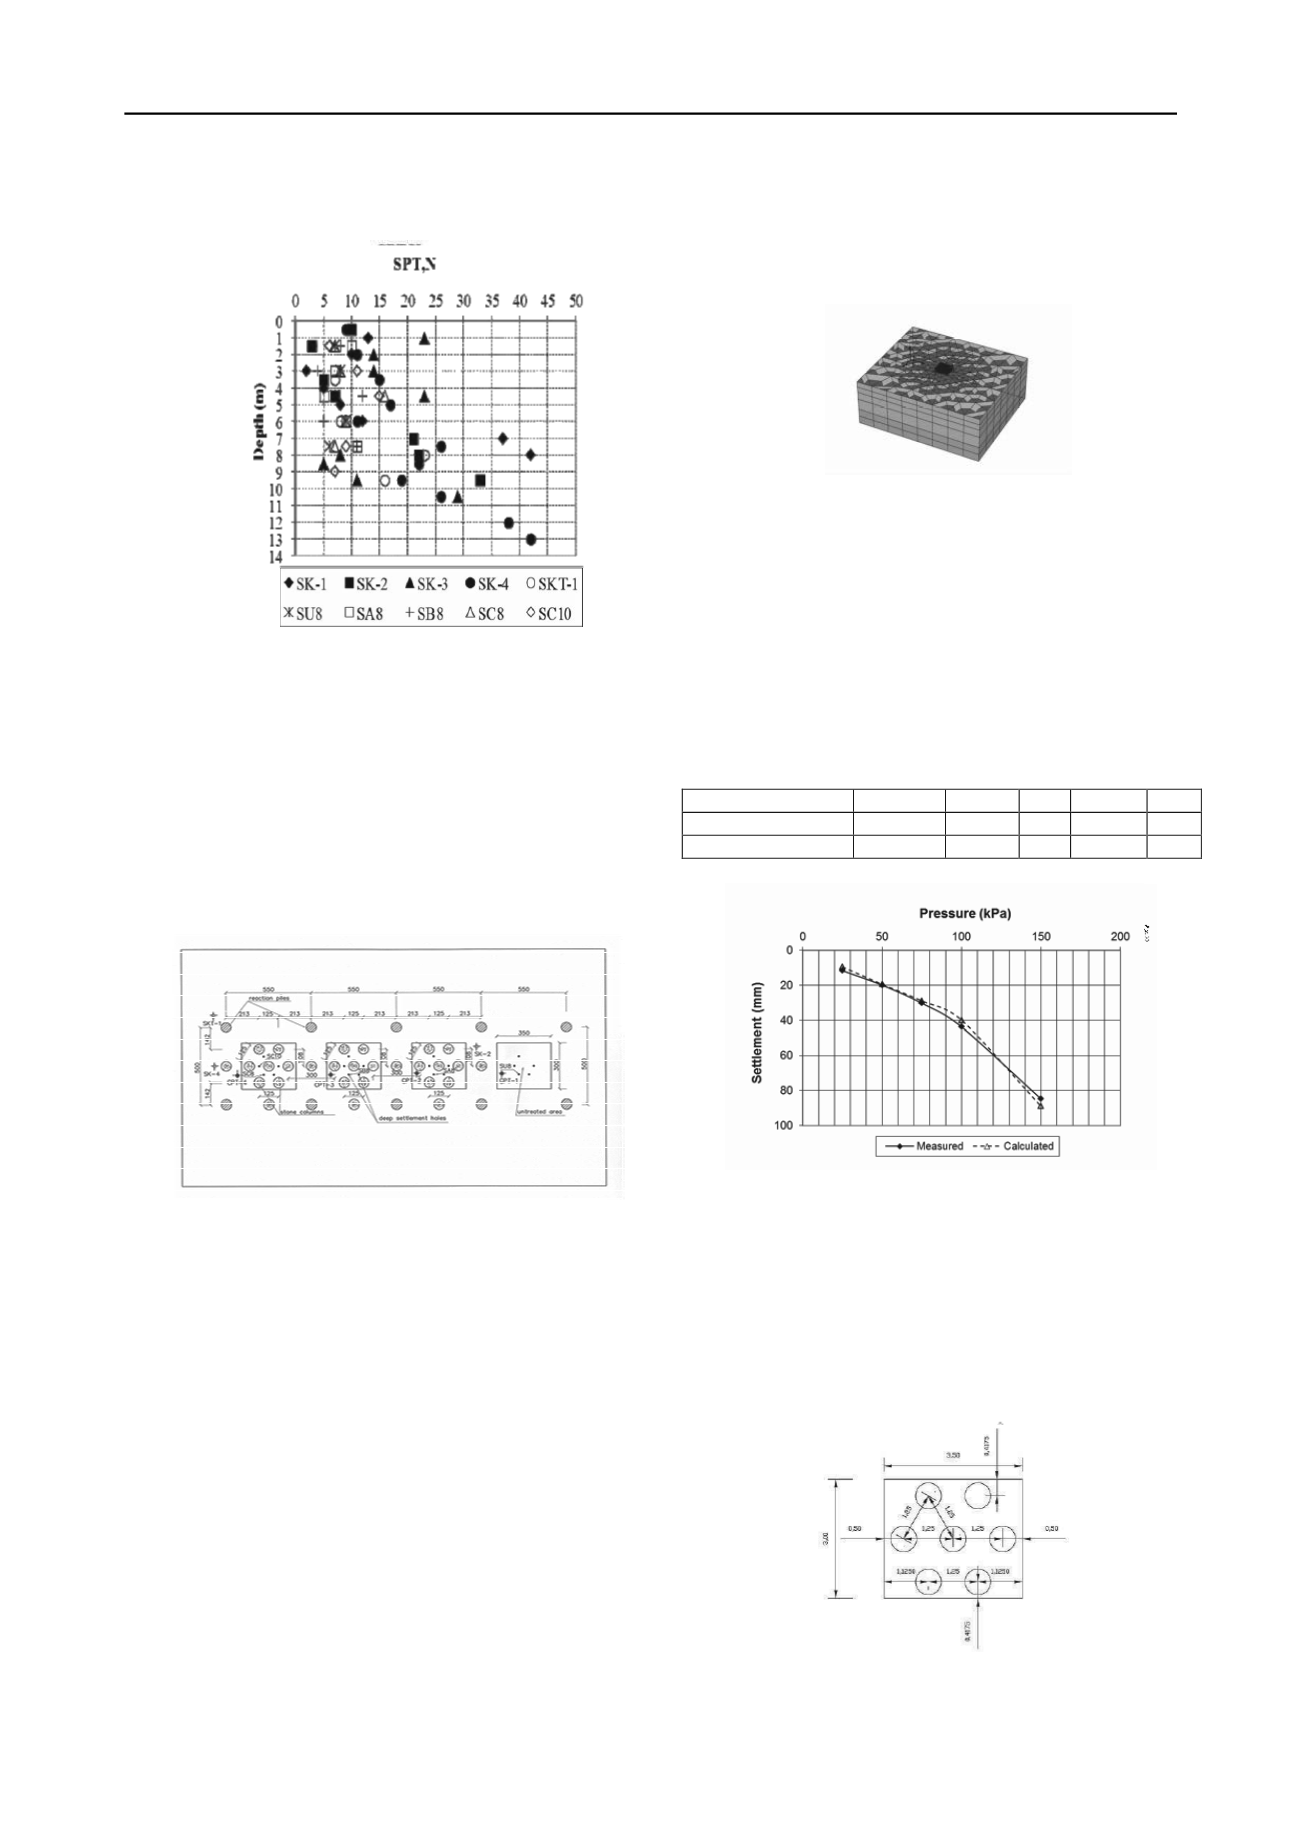
The ground water is located near the surface.
Figure 2. Variation of SPT-N values with depth at the test site.
Four large plate load tests were conducted at the load test
site. Rigid steel plates having plan dimensions of 3.0m by 3.5m
were used for loading. First load test was on untreated soil.
Second load test was Group A loading on improved ground
with aggregate piers of 3.0m length, third load test was Group B
loading on improved ground with aggregate piers of 5.0m
length and finally fourth load test was Group C loading on
improved ground with aggregate pier lengths of 8.0m. Each
aggregate pier groups, i.e. Group A, Group B, and Group C,
consisted of 7 piers installed with a spacing of 1.25 m in a
triangular pattern. The pier diameter was 65cm. (See Figure 3)
Figure 3. Location of aggregate piers at the test site.
For each group of aggregate piers, deep settlement plates
were installed at 1.5m, 3m, 5m, 8m and 10m depths. 10cm thick
fine sand layers were laid and compacted to level the surface
before placing the total pressure cell on top of the center
aggregate pier. The loading sequence for untreated soil load test
was cyclic and at each increment and decrement, load was kept
constant until the settlement rate was almost zero. For aggregate
pier groups, the loading sequence was 50, 100, 150, 200, 250,
150, 0 kPa. Two surface movements, one at the corner and one
at the center of the loading plate, and five deep movement
measurements were taken with respect to time.
The data of the plate loading test on untreated soil was used
for calibrating the finite element model. Geotechnical finite
element software PLAXIS 3D Foundation which offers the
possibility of 3D finite element modeling was used for the
analysis. Loading plate, which has dimensions of 3.0mx3.5m,
was modeled as a rigid plate and the loading was applied as a
uniformly distributed vertical load on this plate according to the
loading scheme used during the actual field test. The boundaries
of the 3D finite element mesh was extended 4 times the loading
plate dimensions in order to minimize the effects of model
boundaries on the analysis. The height of the finite element
model was selected as 12meters. The first 8 meters was the
compressible silty clay layer and the remaining 4 meters was the
relatively incompressible stiff clayey sand (weathered
greywacke) layer. An isometric view of the 3D model is given
in Figure 4.
Figure 4. Isometric view of the 3D finite element model.
Both the compressible and relatively incompressible soil
layers was modeled using the elastic-perfectly plastic Mohr-
Coulomb soil model. Groundwater level was defined at the
surface. The parameters of the relatively incompressible layer
was set to high values, and various geotechnical parameters was
assigned to the compressible layer until the surface load-
settlement curve calculated from the finite element model
matches with the field test data carried on untreated soil. The
closest match, which is shown in Figure 5, was obtained with
the parameters presented at Table 1.
Table 1. Calibrated soil parameters to be used in the finite element
analyses.
Unit
(kN/m
3
) c (kPa)
°
E (kPa)
Silty clay (0-8m)
18
22
0 4500 0.35
Clayey sand (8-12m)
20
0
40 50000 0.30
Figure 5. Comparison of surface load settlement curves for untreated
soil
Once the geotechnical parameters of the native soil were
determined, the next step was to model the field tests on three
different rammed aggregate pier groups (i.e. Group A, Group B
and Group C). In all three tests the rammed aggregate pier
layout was similar (Figure 6) and the lengths of the aggregate
piers were 3m, 5m and 8m for Group A, Group B and Group C,
respectively. The size of the loading plate was 3.0mx3.5m, as it
was the case at the field test on untreated soil.
Figure 6. Field test rammed aggregate pier layout
Figure 2. Variation of SPT-N values with depth at the test site.
Four large plate load tests were conducted at the load test
site. Rigid steel plates having plan dimensions of 3.0m by 3.5m
were used for loading. First load test was on untreated soil.
Second load test was Group A loading on improved ground
with aggregate piers of 3.0m length, third load test was Group B
loading on improved ground with aggregate piers of 5.0m
length and finally fourth load test was Group C loading on
improved ground with aggregate pier lengths of 8.0m. Each
aggregate pier groups, i.e. Group A, Group B, and Group C,
consisted of 7 piers installed with a spacing of 1.25 m in a
triangular pattern. The pier diameter was 65cm. (See Figure 3)
Figure 3. Location of aggregate piers at the test site.
For each group of aggregate piers, deep settlement plates
were installed at 1.5m, 3m, 5m, 8m and 10m depths. 10cm thick
fine sand layers were laid and compacted to level the surface
before placing the total pressure cell on top of the center
aggregate pier. The loading sequence for untreated soil load test
was cyclic and at each increment and decrement, load was kept
constant until the settlement rate was almost zero. For aggregate
pier groups, the loading sequence was 50, 100, 150, 200, 250,
150, 0 kPa. Two surface movements, one at the corner and one
at the center of the loading plate, and five deep movement
measurements were taken with respect to time.
The data of the plate loading test on untreated soil was used
for calibrating the finite element model. Geotechnical finite
element software PLAXIS 3D Foundation hich offers the
possibility of 3D finite element modeling was used for the
analysis. Loading plate, which has dimensions of 3.0mx3.5m,
was modeled as a rigid plate and the loading was applied as a
uniformly distributed vertical load on this plate according to the
loading scheme used during the actual field test. The boundaries
of the 3D finite element mesh was extended 4 times the loading
plate dimensions in order to minimize the effects of model
boundaries on the analysis. The height of the finite element
model was selected as 12meters. The first 8 meters was the
compressible silty clay layer and the remaining 4 meters was the
relatively incompressible stiff clayey sand (weathered
grey acke) layer. n iso etric vie of the 3 odel is given
in Figure 4.
Figure 4. Isometric view of the 3D finite element model.
Both the co pressible and relatively incompressible soil
layers as modeled using the elastic-perfectly plastic Mohr-
Coulo b soil odel. Groundwater level was defined at the
surface. The para eters of the relatively inco pressible layer
as set to high values, and various geotechnical parameters was
assigned to the compressible layer until the surface load-
settlement curve calculated from the finite element model
atches ith the field test data carried on untreated soil. The
closest match, which is shown in Figure 5, was obtained with
the parameters presented at Table 1.
Table 1. Calibrated soil parameters to be used in the finite element
analyses.
Unit
(kN/m
3
) c (kPa)
°
E (kPa)
Silty clay (0-8m)
18
22
0 4500 0.35
Clayey sand (8-12m)
20
0
40 50000
0.30
Figure 5. Comparison of surface load settlement curves for untreated
soil
Once the geotechnical para eters of the native soil were
determined, the next step was to model the field tests on three
different rammed aggregate pier groups (i.e. Group A, Group B
and Group C). In all three tests the ra ed aggregate pier
layout was similar (Figure 6) and the lengths of the aggregate
piers were 3 , 5 and 8 for Group A, Group B and Group C,
respectively. The size of the loading plate was 3.0mx3.5m, as it
was the case at the field test on untreated soil.
Figure 6. Field test rammed aggregate pier layout
The field load tests on rammed aggregate pier groups were
again modeled by PLAXIS 3D Foundation. The size of the
finite element mesh was kept the same as the model for the test
on untreated soil for comparison purposes. Material model and
geotechnical parameters derived from the calibration process
Figure 2. Variation of SPT-N values with depth at the test site.
Four large plate load tests were conducted at the load test
site. Rigid steel plates having plan dimensions of 3.0m by 3.5m
were used f r loading. First load test was on untreated soil.
Second load test was Group A loading on improved ground
with aggregate piers of 3.0m length, third load test was Group B
loading on improved ground with aggregate piers of 5.0m
length and finally fourth load test was Group C loading on
improved ground with aggregate pier lengths of 8.0m. Each
aggregate pier groups, i.e. Group A, Group B, and Group C,
consisted of 7 piers installed with a spacing of 1.25 m in a
triangular pattern. The pier diameter was 65cm. (See Figure 3)
Figure 3. Location of aggregate piers at the test site.
For each group of aggregate piers, deep settlement plates
were installed at 1.5m, 3m, 5m, 8m and 10m depths. 10cm thick
fine sand layers we laid and compacted to level the surface
before placing the total pressure cell on top of the center
aggregate pier. The loading sequence for untreated soil load test
was cyclic and at each increment and decrement, load was kept
constant until the settlement rate was almost zero. For aggregate
pier groups, the loading sequence was 50, 100, 150, 200, 250,
150, 0 kPa. Two surface movements, one at the corner and one
at the center of the loading plate, and five deep movement
measurements were taken with respect to time.
The data of the plate loading test on untreated soil was used
for calibrating the finite element model. Geotechnical finite
element software PLAXIS 3D Foundation which offers the
possibility of 3D finite element modeling was used for the
analysis. Loading plate, which has dimensions of 3.0mx3.5m,
was modeled as a rigid plate and the loading was applied as a
uniformly distributed vertical load on this plate according to the
loading scheme used during the actual field test. The boundaries
of the 3D finite element mesh was extended 4 times the loading
plate dimensions in order to minimize the effects of model
boundaries on the analysis. The height of the finite element
model was selected as 12meters. The first 8 meters was the
compressible silty clay layer and the remaining 4 meters was the
relatively incompressible stiff clayey sand (weathered
greywacke) layer. An iso etric view of the 3D model is given
in Figure 4.
Figure 4. Isometric view of the 3D finite element model.
Both the compressible and relatively incompressible soil
layers was modeled using the elastic-perfectly plastic Mohr-
Coulomb so l model. Groundwater level was defined at the
surface. The parameters of the relatively incompressible layer
was set to high values, and various geotechnical parameters was
assigned to the compressible layer until the surface load-
settlement curve calculated from the finite element model
matches with the field test data carried on untreated soil. The
closest match, which is shown in Figure 5, was obtained with
the parameters presented at Table 1.
Table 1. Calibrated soil parameters to be used in the finite element
analyses.
Unit
(kN/m
3
) c (kPa)
°
E (kPa)
Silty clay (0-8m)
18
22
0 4500 0.35
Clayey sand (8-12m)
20
0
40 50000
0.30
Figure 5. Comparison of surface load settlement curves for untreated
soil
Once the geotechnical parameters of the native soil were
determined, the ext tep was to model the field tests on hree
different rammed aggregate pier groups (i.e. Group A, Group B
and Group C). In all three tests the rammed aggregate pier
layout was similar (Figure 6) and the lengths of the aggregate
piers were 3m, 5m and 8m for Group A, Group B and Group C,
respectively. The size of the loading plate was 3.0mx3.5m, as it
was the case at the field test on untreated soil.
Figure 6. Field test rammed aggregate pier layout
The field load tests on rammed aggregate pier groups were
again modeled by PLAXIS 3D Foundation. The size of the
finite element mesh was kept the same as the model for the test
on untreated soil for comparison purposes. Material model and
geotechnical parameters derived from the calibration process
Figure 2. Variation of SPT-N values with depth at the test site.
Four large plate load tests were conducted at the load test
site. Rigid steel p ates having plan imension f 3.0m by 3.5m
were used for loading. Fi st load test was on untreated s il.
Second load test was Group A loading on improved ground
with aggregate pie s of 3.0m length, ird load test was Group B
loading on improved g ound wi h aggregate iers of 5.0m
length and finally fourth load test was Group C loading on
improved ground with aggregate ier lengths of 8.0m. Each
aggrega pier groups, i.e. Group A, Group B, and Group C,
consisted of 7 piers installe with a spacing of 1.25 m in a
triangular pattern. The pier diameter was 65cm. (See Figure 3)
Figure 3. Location of aggregate piers at the test site.
For each group of aggregate piers, deep s ttlement plates
were installed at 1.5m, 3m, 5m, 8m and 10m depths. 10cm thick
fin sand l yers were laid and compacted to level the surface
before placing the tot l pre sure c ll on op of the center
aggregate pier. The loading s quence for untreated s il load test
was cyclic and at each increment and decrement, load was kept
constant until the settlement rat was almost zero. For aggregate
pier groups, the loading sequence was 50, 100, 150, 200, 250,
150, 0 kPa. Two surface movements, one at th corner and on
at the cent r of th loading plate, and five deep movement
measur ments were taken with resp c t time.
The data of the plate loading tes on untreat d soil was used
for calibrating the finite element model. Geotechnical finite
element software PLAXIS 3D Foundatio which offers the
possibil ty of 3D finite element mo eling wa used for the
analysis. Loa ing plate, which has dimensions of 3.0mx3.5m,
was modeled as a rigid plate and the loading was appl ed as a
uniformly distributed vertical load on this plat according to the
loading scheme used during the actual fiel test. The boundaries
of the 3D finite element m sh was extend d 4 times the loading
plate dimensi s in order to minimize he eff cts of model
boundaries on the analysis. The height of the finite element
model was selected as 12meters. The first 8 meters was the
compressible silty clay layer and the remaining 4 meters was the
relatively incompressible stiff clayey sand (weathered
greywacke) layer. An isometric view of the 3D model is given
in Figure 4.
Figure 4. Isometric view of the 3D fin te l ment model.
Both the compressible and relatively incompressible soil
layers was model d using the elastic-perfectly plastic Mohr-
Coulomb soil model. Groundwater level was defined at he
surface. The par met rs of the relatively incompressible layer
was et to high values, and various geotechnical paramet rs was
assigned to the compressible layer until the surface load-
settlement curve calculated from the fin te el ment model
matches with the field test dat carried on untreated soil. The
closest match, which is hown in Figure 5, was obtained with
the par met rs pres nted at Table 1.
Table 1. Calibrated soil par met rs to be used in the fin te l ment
analyses.
Unit
(kN/m
3
) c (kPa)
°
E (kPa)
Silty clay (0-8m)
18
22
0 4500 0.35
Claye sand (8-12m)
20
0
40 500
0.30
Figure 5. Comparison of surface load settlement curves for untreated
soil
Once the geotechnical par meters of the native soil wer
det rmined, the next step was to model the field test on three
differ nt ram ed ag regate pier groups (i.e Group A, Group B
and Group C). In all three test the rammed aggregate pier
layout was similar (Figure 6) and the lengths of the ag regate
piers wer 3m, 5m and 8m for Group A, Group B and Group C,
respectively. The size of the loading plate was 3.0mx3.5m, as it
was the case at the field test on untreated soil.
Figure 6. Field test ram ed aggregate pier layout
The field load tests on rammed aggregate pier groups were
again modeled by PLAXIS 3D Foundation. The size of the
finite element mesh was kept the same as the model for the test
on untreated soil for comparison purposes. Material model and
geotechnical parameters derived from the calibration process


