3457
Technical Committee CFMS /
Comité technique CFMS
The field load tests on rammed aggregate pier groups were
again modeled by PLAXIS 3D Foundation. The size of the
finite element mesh was kept the same as the model for the test
on untreated soil for comparison purposes. Material model and
geotechnical parameters derived from the calibration process
were used for the native soil. Rammed aggregate piers were
modeled with linear elastic material model and modulus of
elasticity value was given as E = 39 MPa, as recommended by
Özkeskin (2004), which is backcalculated from single pier load
tests. Loading plate, which has dimensions of 3.0mx3.5m, was
modeled as a rigid plate and the loading was applied as a
uniformly distributed vertical load on this plate according to the
loading scheme used during the actual field test. Calculated
surface pressure-settlement curves for each aggregate pier
groups are compared with the field measurements in Figure 7.
(Surface pressure values are normalized with respect to the
ultimate bearing capacity, q
ult
, of the untreated soil.) The
calculated surface settlements are larger than the measured ones
for all cases.
Figure 7. Comparison of surface load-settlement curves for loading on
Group A rammed aggregate piers (Normal 3D FEM Model)
The observed stiffer and near-linear-elastic behaviour of
aggregate pier groups can be explained by the increase of lateral
stress in the matrix soil around the rammed aggregate piers
caused by the ramming action during the installation of the
piers. This increase in lateral stress of matrix soil results in
improved stiffness characteristics as explained by Handy
(2001). In order to match the observed stiffer and near-linear-
elastic behaviour of actual field test measurements, it is decided
to define linear elastic improved zones around the rammed
aggregate piers at the 3D finite element model. It is assumed
that a circular zone with a radius equal to two times of the
rammed aggregate pier radius is improved around the rammed
aggregate piers. (Modified Ring Model) This circular zone is
also divided into two zones. (Figure 8) It is assumed that the
modulus of elasticity value of the improved soil around the
rammed aggregate pier increases to 2/3 of the modulus of
elasticity value of the rammed aggregate pier at the first
improved zone - r = 1.5r
aggregate pier
-, and to 1/3 of the modulus
of elasticity value of the rammed aggregate pier at the second
improved zone - r = 2.0r
aggregate pier
-.
Figure 8. Geometry of the assumed improved zones around the rammed
aggregate piers
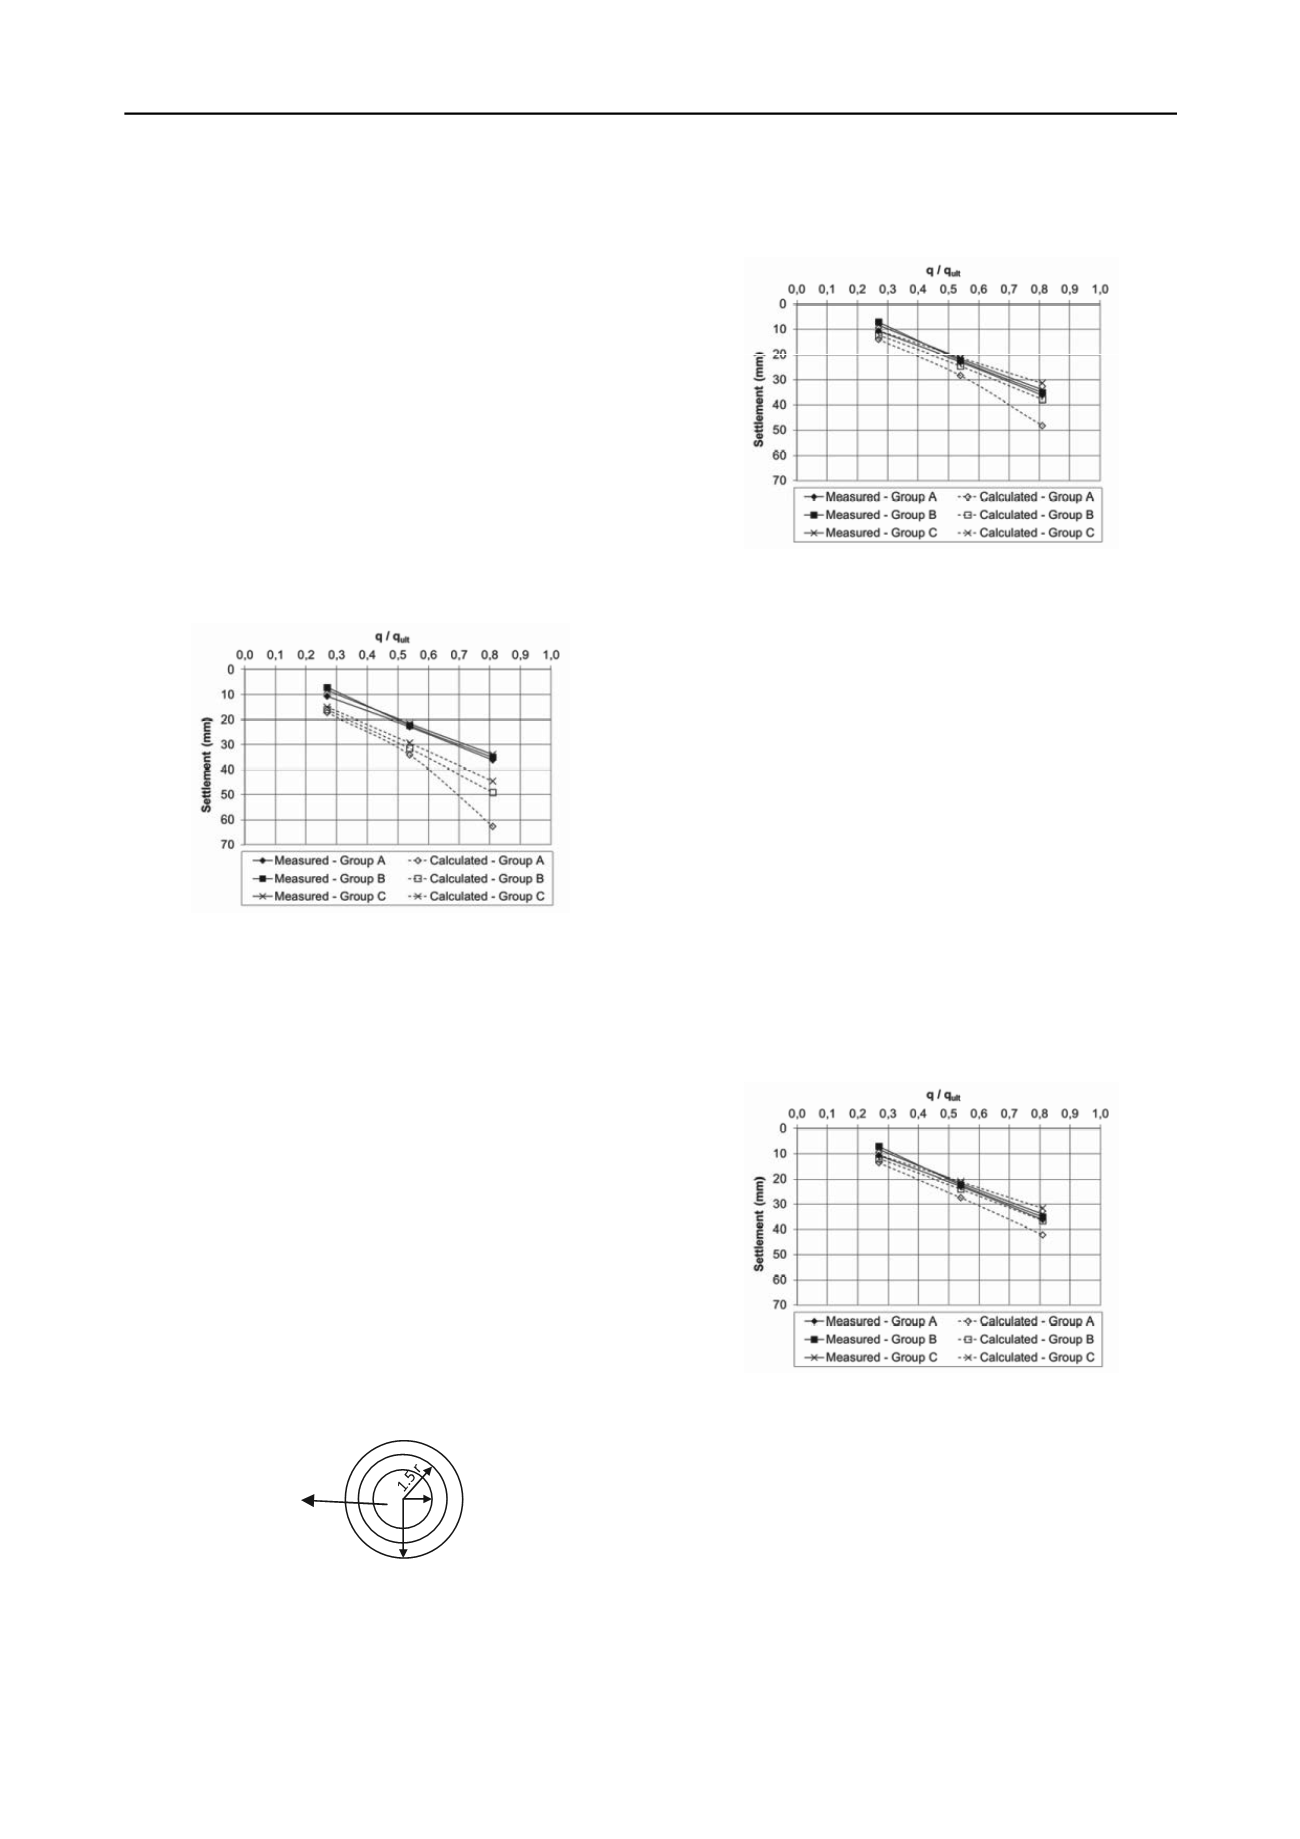
Calculated surface pressure-settlement curves for each
aggregate pier groups are compared with the field
measurements in Figure 9. Calculated load-settlement curves fit
to the expected near-linear-elastic behavior much better than
before. The agreement with the measured surface settlement
values are quite satisfactory for Group B and Group C loadings.
Figure 9. Comparison of surface load-settlement curves for loading on
Group A rammed aggregate piers (Modified Ring Model)
The next step is to try to simplify this improved near-linear-
elastic zone assumption (Modified Ring Model) so that it can be
easily used for practical analyses. For this purpose, the area
under the loading plate with the rammed aggregate piers is
modeled as a composite soil block (Composite Soil Model).
Linear elastic material model is used for the composite soil
block and the modulus of elasticity of this composite zone is
calculated as the weighted average of the rammed aggregate
pier, improved zones around the rammed aggregate pier, and
native soil, according to their respective areas. The improved
modulus of elasticity values were selected as 2/3 of the modulus
of elasticity value of the rammed aggregates pier at the first
improved zone - r = 1.5r
aggregate pier
- , and to 1/3 of the modulus
of elasticity value of the rammed aggregates pier at the second
improved zone - r = 2.0r
aggregate pier
- , as concluded before.
Calculated surface pressure-settlement curves for this case are
compared with the field measurements in Figure 10. Calculated
load-settlement curves with the Composite Soil Model yield
more close results to the measured values than the Modified
Ring Model, especially for floating pier groups. (i.e. Group A
and Group B)
Figure 10. Comparison of surface load-settlement curves for loading on
Group A rammed aggregate piers (Composite Soil Model)
As a result of the calibration process detailed in this chapter,
it is concluded that the 3D finite element model, i.e. the
Composite Soil Model, in which the area under the loading
plate with the rammed aggregate piers is modeled as a
composite soil block with equivalent linear elastic soil
properties taking the stiffness increase around the piers during
the installation process into account, satisfactorily models the
surface pressure-settlement curves of uniformly loaded footings
supported by rammed aggregate piers. It is to be mentioned that
the model should be used cautiously for floating pier groups
with pier lengths less than 1.5B (B = width of the footing),
especially at high surface pressure levels , i.e. q / q
ult
> 0.5,
where q
ult
= ultimate bearing capacity of the native soil.
r
2r
Rammed aggregate pier


