 
          3461
        
        
          Technical Committee CFMS /


            Comité technique CFMS


          100 kPa assuming it to be in the range of working load. The
        
        
          same are presented in Table 2.
        
        
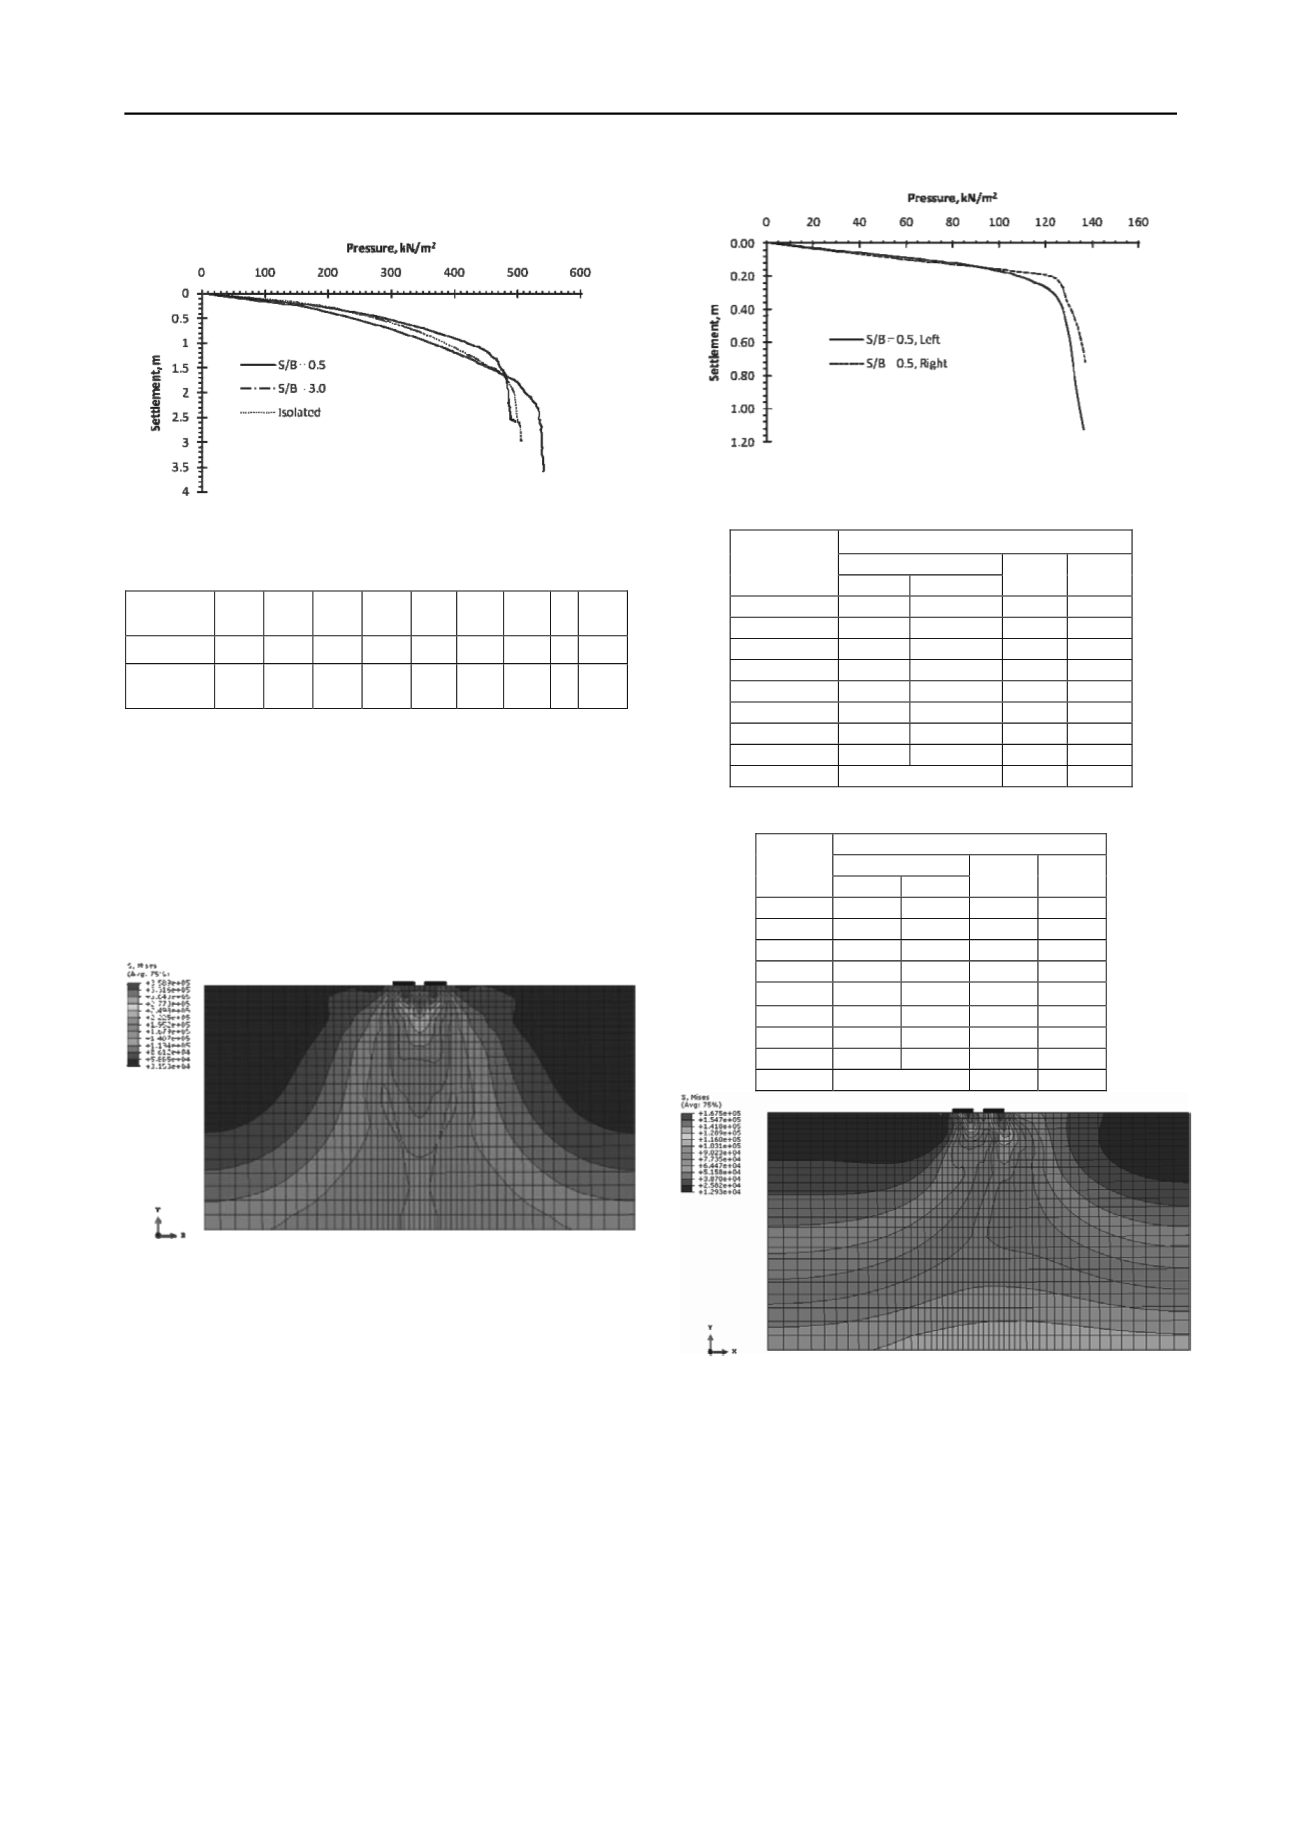
          Figure 5. Pressure settlement curves for case a
        
        
          Table 2. Bearing capacity and settlements of footing for case a.


            S/B


            0.5


            1


            1.5


            2


            2.5


            3


            3.5 5 Isolat


            ed


            UBC, kPa


          545 520 515 510 505 495 495 495 495


            δ, mm (at


            100 kPa)


          156.5 148.1 141.3 135.9 131.4 127.8 124.7 118 105.7
        
        
          It is observed from Table 2, that the UBC of interfering
        
        
          footings decreases with increase in S/B ratio and attains the
        
        
          value as that of isolated footing at higher spacing. At S/B = 0.5,
        
        
          the UBC is observed to be increased by about 10% compared to
        
        
          isolated footing. This is due the overlapping of the stress zones
        
        
          of individual footing when placed close to each other. The same
        
        
          can be observed from the stress contour plot as presented in
        
        
          Figure 6. Similar kind of variation is seen for the settlements at
        
        
          working load. The settlement is increased by 48% when the
        
        
          footings are placed at S/B = 0.5 and the percentage increase in
        
        
          the settlement decreases with increase in S/B ratio.
        
        
          Figure 6. Stress contour for case a at S/B equal to 0.5.
        
        
          As the case b, is unsymmetrical case the pressure settlement
        
        
          curves are obtained for both left and right footings at different
        
        
          S/B ratio and are seen to be non-identical. The pressure
        
        
          settlement curve for case b is obtained at S/B = 0.5 and shown
        
        
          in Figure 7. The UBC is calculated owing to the interference for
        
        
          left and right footings placed at different spacing and are
        
        
          presented in Table 3. Similarly the settlements, δ obtained at
        
        
          working load of 100 kPa are presented in Table 4. It is observed
        
        
          that the UBC of both footings decreases by 14% at S/B = 0.5
        
        
          compared to that of isolated footing under same loading
        
        
          condition. However, at S/B = 2.5, the UBC of two footings
        
        
          attain a value as that of isolated footing and remains constant
        
        
          with further increase in S/B ratio. It is also observed that the
        
        
          settlement of left and right footing at working load is increased
        
        
          by 59% and 49% at S/B = 0.5 and decreases to 23% and 11%,
        
        
          respectively at S/B = 5.0 compared to that of isolated footing.
        
        
          The stress contour for case b at S/B = 0.5 is shown in Figure 8
        
        
          and it is seen that the stress contours of right footing do not
        
        
          overlap much with that of left footing and hence negligible
        
        
          interference phenomenon is observed however the effect on
        
        
          settlement is higher.
        
        
          Figure 7. Pressure settlement curve of case b at S/B = 0.5.
        
        
          Table 3. UBC (kPa) of interfering footings for case b, c and d.


            Case


            b


            S/B


            Left


            Right


            c


            d


            0.5


          125
        
        
          125
        
        
          135
        
        
          140


            1.0


          128
        
        
          130
        
        
          145
        
        
          145


            1.5


          130
        
        
          130
        
        
          145
        
        
          145


            2.0


          140
        
        
          140
        
        
          145
        
        
          145


            2.5


          145
        
        
          145
        
        
          145
        
        
          145


            3.0


          145
        
        
          145
        
        
          145
        
        
          145


            3.5


          145
        
        
          145
        
        
          145
        
        
          145


            5.0


          145
        
        
          145
        
        
          145
        
        
          145


            Isolated


            145


            145


            145


          Table 4. Settlement, δ (mm) obtained at 100 kPa load.


            Case


            b


            S/B


            Left


            Right


            c


            d


            0.5


          166.79 155.52 155.96 155.04


            1.0


          162.61 145.84 148.28 146.46


            1.5


          157.10 140.21 141.69 140.95


            2.0


          151.56 135.44 131.91 136.38


            2.5


          146.94 130.85 130.95 132.52


            3.0


          142.59 126.93 127.16 129.11


            3.5


          138.66 123.57 124.04 126.10


            5.0


          128.95 116.13 117.03 118.97


            Isolated


            104.70


            104.70 104.70


          Figure 8. Stress contours for case b at S/B equal to 0.5.
        
        
          Similarly, the pressure settlement curves are obtained for
        
        
          case c and case d. It is observed that the curves obtained from
        
        
          both left and right footings are exactly identical. From the
        
        
          obtained curves, the UBCand settlements at working load of
        
        
          100 kPa are obtained and the same are tabulated in Table 3 and
        
        
          Table 4, respectively. The pressure settlement curves obtained
        
        
          for footings placed at S/B = 0.5 are shown in Figure 9 for case c
        
        
          and case d. The stress contour plot for case c and case d
        
        
          obtained by placing the footings at S/B = 0.5 are shown in
        
        
          Figure 10 and Figure 11 respectively. It is observed that the
        
        
          UBC of interfering footing decreases by 7% at S/B = 0.5 and at
        
        
          all S/B ratios the bearing capacity value remains same as that of
        
        
          isolated footing, revealing negligible or no effect of interference
        
        
          on the bearing capacity. However significant effect of
        
        
          interference on the settlement is observed. 49% increase in