3469
Technical Committee CFMS /
Comité technique CFMS
3
confining pressure (calculated using
= 0.70
and a
capillary stress of 3 kPa);
reference mean effective
confining pressure, 1 atm; and
slope of the
log
log
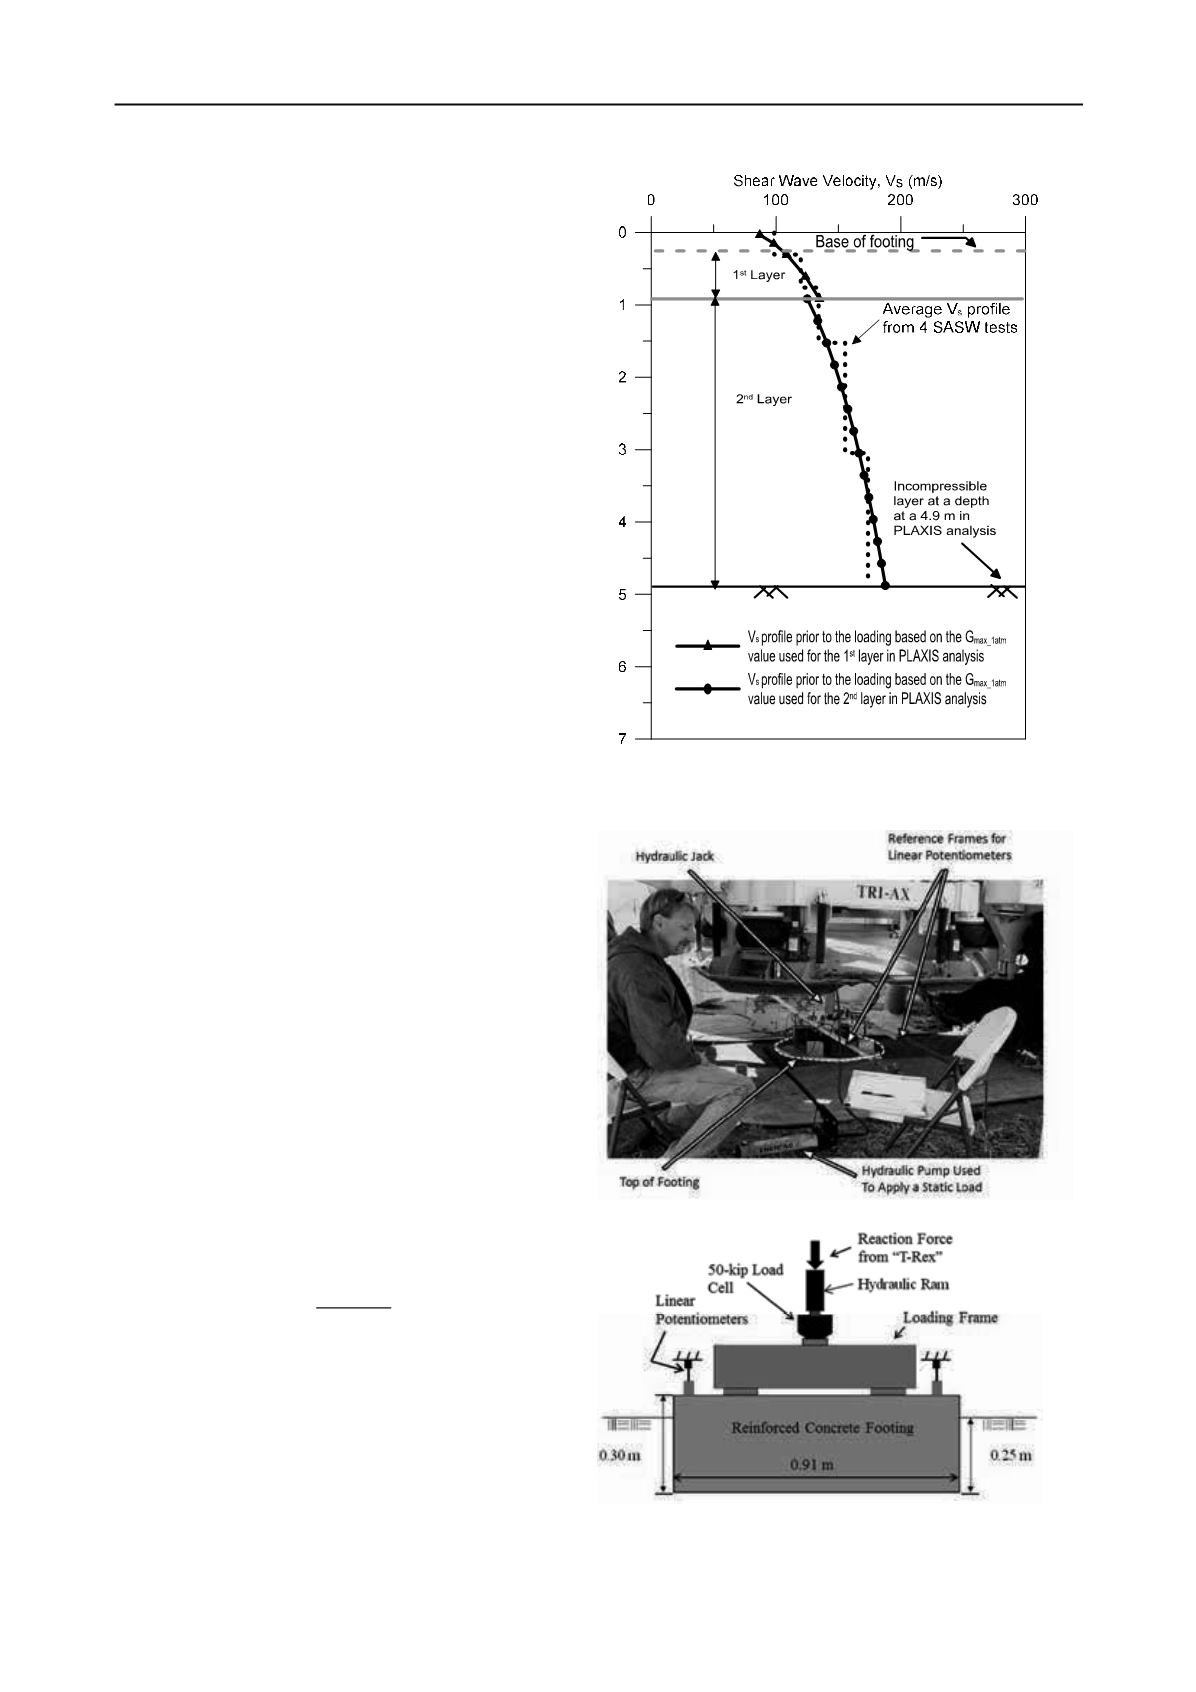
relationship. The modeling represented by
Equation 3 resulted in the two-layer profile presented in
Fi ure 2. The G
max_1atm
and n
G
parameters for each layer are:
layer 1 - G
max_1atm
= 86.2 MPa and 0.48; layer 2 - G
max_1atm
=
74.2 MPa and 0.51, respectively. The values of n
G
close to
0.5 indicate that the soil in each layer is uncemented.
4.2.
Load-Settlement Test
A reinforced concrete footing with a diameter of 0.91 m and
a thickness of 0.30 m was constructed at the site after
removing the upper 0.25 m of soil. Linear potentiometers,
attached to a reference frame were used to measure footing
settlements. The load was applied by a hydraulic jack
reacting against the weight of a tri-axial vibroseis truck,
named T-Rex, as shown in Figure 3a. The load was
measured with a 50-kip load cell and was applied to the top
of the footing through a loading frame (see Figure 3b). The
load–settlement test was performed in March, 2010. The
measured load-settlement curve is presented in Figure 4 by
the solid line.
5 COMPARISON OF PREDICTED AND MEASURED
LOAD-SETTLEMENT CURVES
To investigate the settlement prediction methods, predicted
and measured load-settlement curves are compared. The
prediction methods are: (1) Schmertmann et al. (1978) CPT-
based method, (2) Burland and Burbidge (1985) SPT-based
method and (3) the method based on dynamic soil properties
presented herein. The predicted and measured load-
settlement curves are presented in Figure 4 and are discussed
below.
For the Schmertmann et al. method, the elastic moduli
were calculated based on the CPT results using:
2.5
(5)
where
modulus of elasticity of the soil; and
cone
penetrometer tip resistance. The upper 2 m of soil under the
footing was divided into 5 layers and an average value of
1.53 MPa of
was assigned to each layer. Additional
details on the procedure can be found in Van Pelt (2010). As
seen in Figure 4, the predicted load-settlement curve is not
as nonlinear as the measured curve, but predicts quite well in
the working-load range.
For the Burland and Burbidge (1985) method, settlements
are estimated using the SPT blow count, N
60
in the
correlation:
1.71
.
.
(6)
where
settlement (mm);
applied bearing pressure
(kPa);
footing diameter (m); and
average SPT
blow count over the depth of influence which is about 1 m
for a footing with B = 1m, uncorrected for overburden
pressure. As no SPT tests were performed at the field site,
the CPT tip resistance values were correlated to SPT blow
count using the correlations proposed by Robertson et al.
(1983). For an average
value of 1.53 MPa, this
correlation gives an average value of 5 for the SPT blow
count. As seen in Figure 4, the predicted load- settlement
Figure 2. Average V
s
profile from SASW tests and the two-layer
model used in the finite element analysis
(a)
(b)
Figure 3. Field Load-settlement test: (a) T-Rex in position during
loading (b) Cross-section of the load-settlement arrangement
Depth (m)


