3448
Proceedings of the 18
th
International Conference on Soil Mechanics and Geotechnical Engineering, Paris 2013
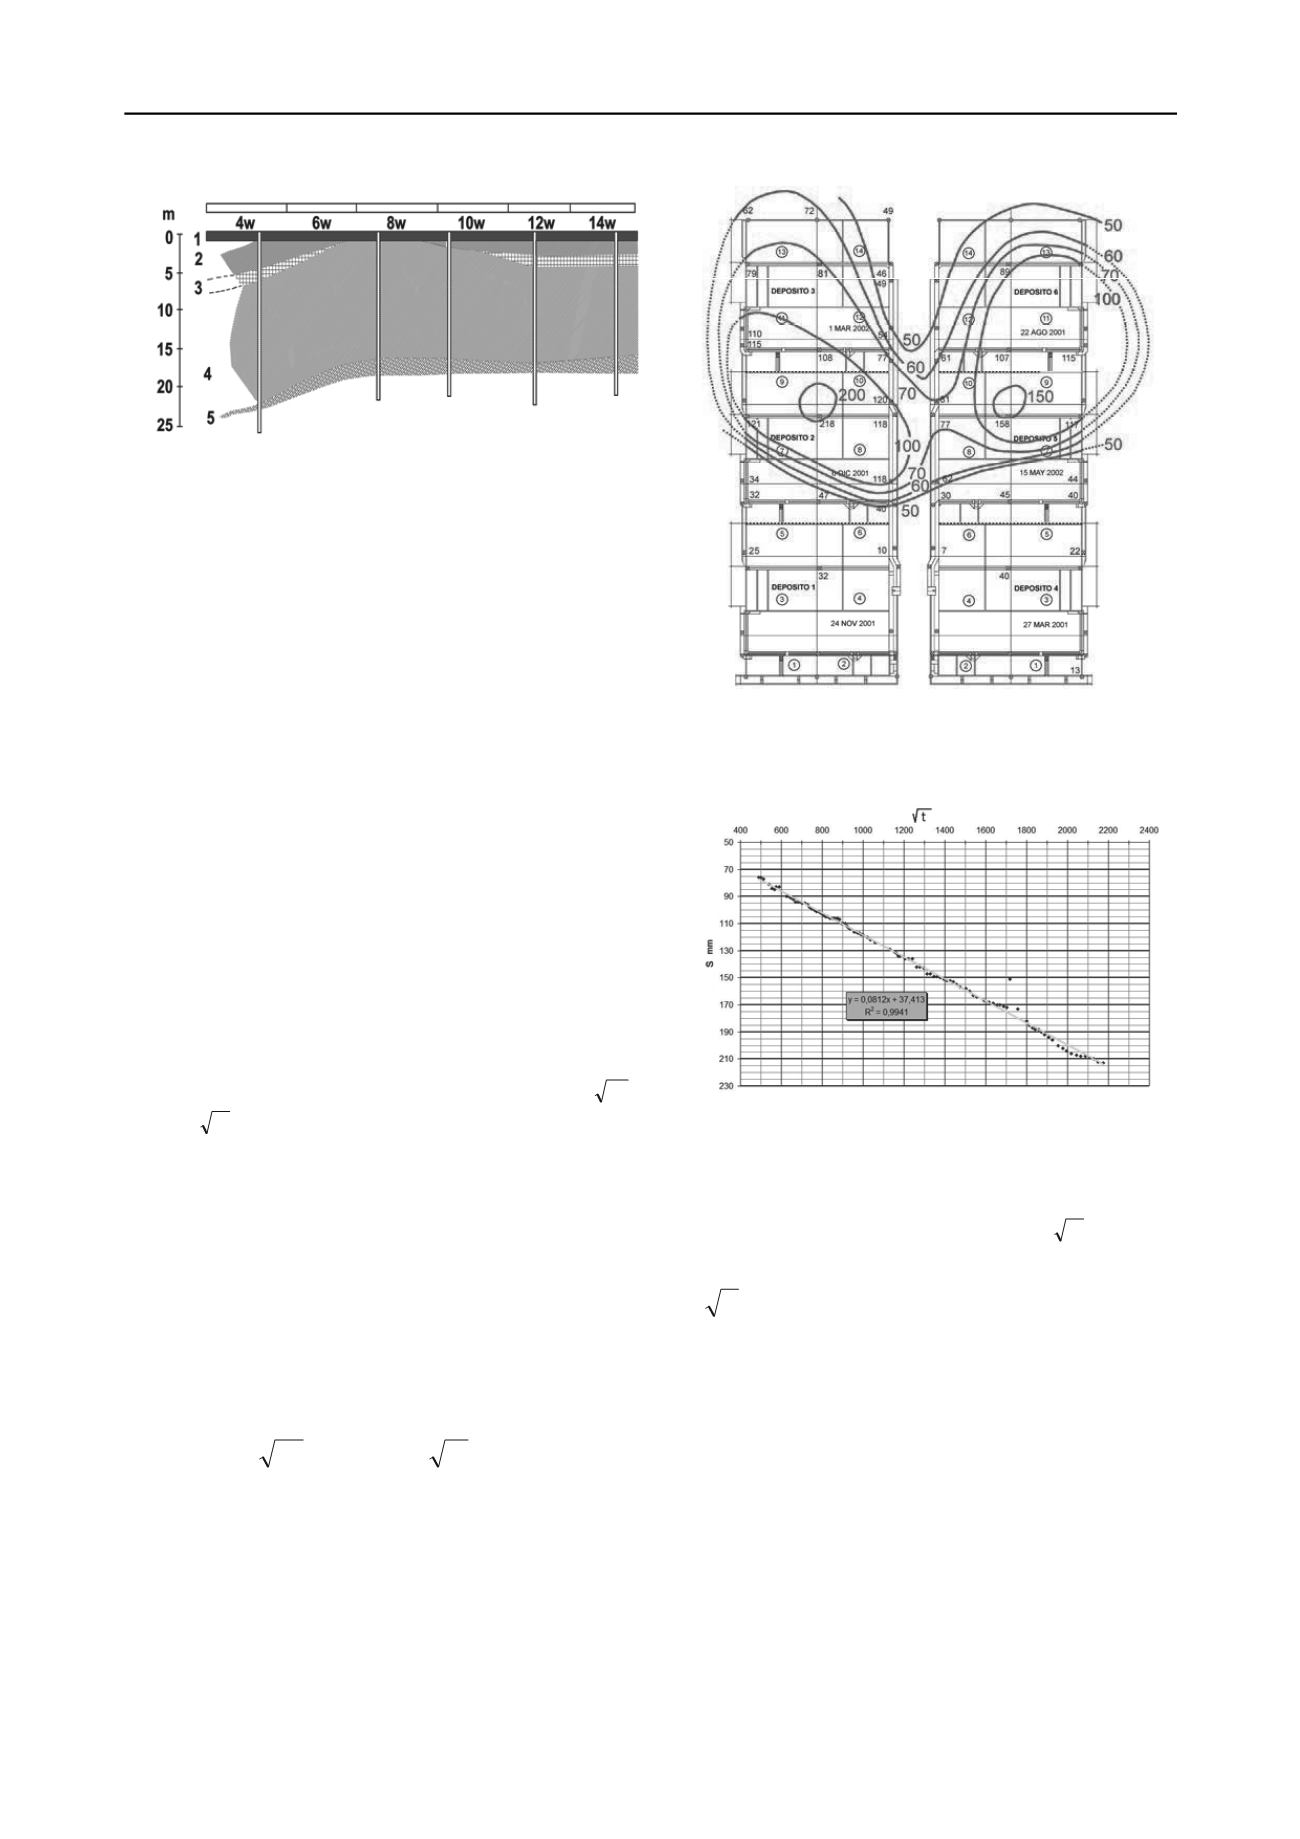
Figure 1. Stratigraphic profile of the soil under the biodigester
foundation slabs. 1. Concrete. 2. Slag. 3 and 4. Silty clay. 5. Clay with
gravel.
This paper discusses the amount of settlement recorded over
the first 10 years since the biodigesters were put into operation
and how it has developed over time. It also identifies how the
pools have behaved differently, delimiting the areas with
settlement and with similar settlement rates
2 SETTLEMENT RECORDED OVER THE 10 YEARS OF
OPERATION
Figure 2 shows the total settlement recorded 10 years after the
phase 2 biodigesters were constructed and filled. There are also
lines connecting points with the same amount of settlement for
the following values: 50, 60, 70, 100, 150 and 200 mm. The 50
mm settlement line includes pools 2, 3, 5 and 6. Pools 1 and 4
have settlement of less than 50 mm. Figure 2. The areas with the
most settlement are in the center of pool 2, where it reaches 218
mm, and the middle of pool 5, where settlement reaches the
level of 158 mm. Despite this significant settlement, no
problems with the operation of the pools have become apparent
3 SETTLEMENT MODELS
Settlement development over the 10 years since the phase 2
biodigesters were constructed resembles the model s = a
m
tm
+ b = a
ta
+ b, where tm is the time since the biodigesters
were first filled expressed in minutes, and ta is this time
expressed in years.
This model was determined by adjusting the settlement
values collected after 2.5 years, as contained in Dapena, et al.
(2005). A least squares adjustment has now been applied to the
settlement values collected for the period between 0.5 and 9
years after the pools were filled, using the computer program.
The corresponding a and b values at each point have thus
been determined, as shown in Table 1.
The graph of how settlement developed at point 53 of pool 2,
where the greatest settlement value was obtained, is shown in
Figure 3, together with the corresponding model.
S
53
= 0.0812
tm
+ 37.4 = 58.9
ta
+ 37.4; R
2
= 0.99
Because a decrease in the settlement rate was noted after 8
years, the model has also been adjusted for the settlement values
measured between 8 and 10 years, obtaining the value a
8-10
.
Table 1.
Figure 2. Contour lines for settlement at the biodigesters in mm.
Settlement measured on March 12, 2012.
Figure 3. Settlement at point 53 of pool 2 based on the root of t (t= time
in minutes) between 0.5 and 9 years and adjustment of the model.
4 DISTRIBUTION OF THE COEFFICIENT
ta
The increase in settlement over time is related to coefficient “a”
of
a
t
in the model used. The greater this coefficient is, the
greater is the increase in settlement which will occur over a
certain period of time.
The distribution of the a
0.5-9
coefficient for the biodigesters is
shown in Figure 4. The lines connect points with the same value
for this coefficient, separating different areas based on this
value. The area of pools 1 and 4, where there was the least
settlement, also has a
0.5-9
coefficients with lower values, less
than a
0.5-9
=5, whereas the center of pool 2 and pool 5, where the
greatest settlement was recorded, have higher values for the
coefficient: a
0.5-9
=58.9 and a
0.5-9
=37.5, respectively.


