3449
Technical Committee CFMS /
Comité technique CFMS
Figure 4. Distribution of values for the coefficient a.
5 SETTLEMENT DEVELOPMENT
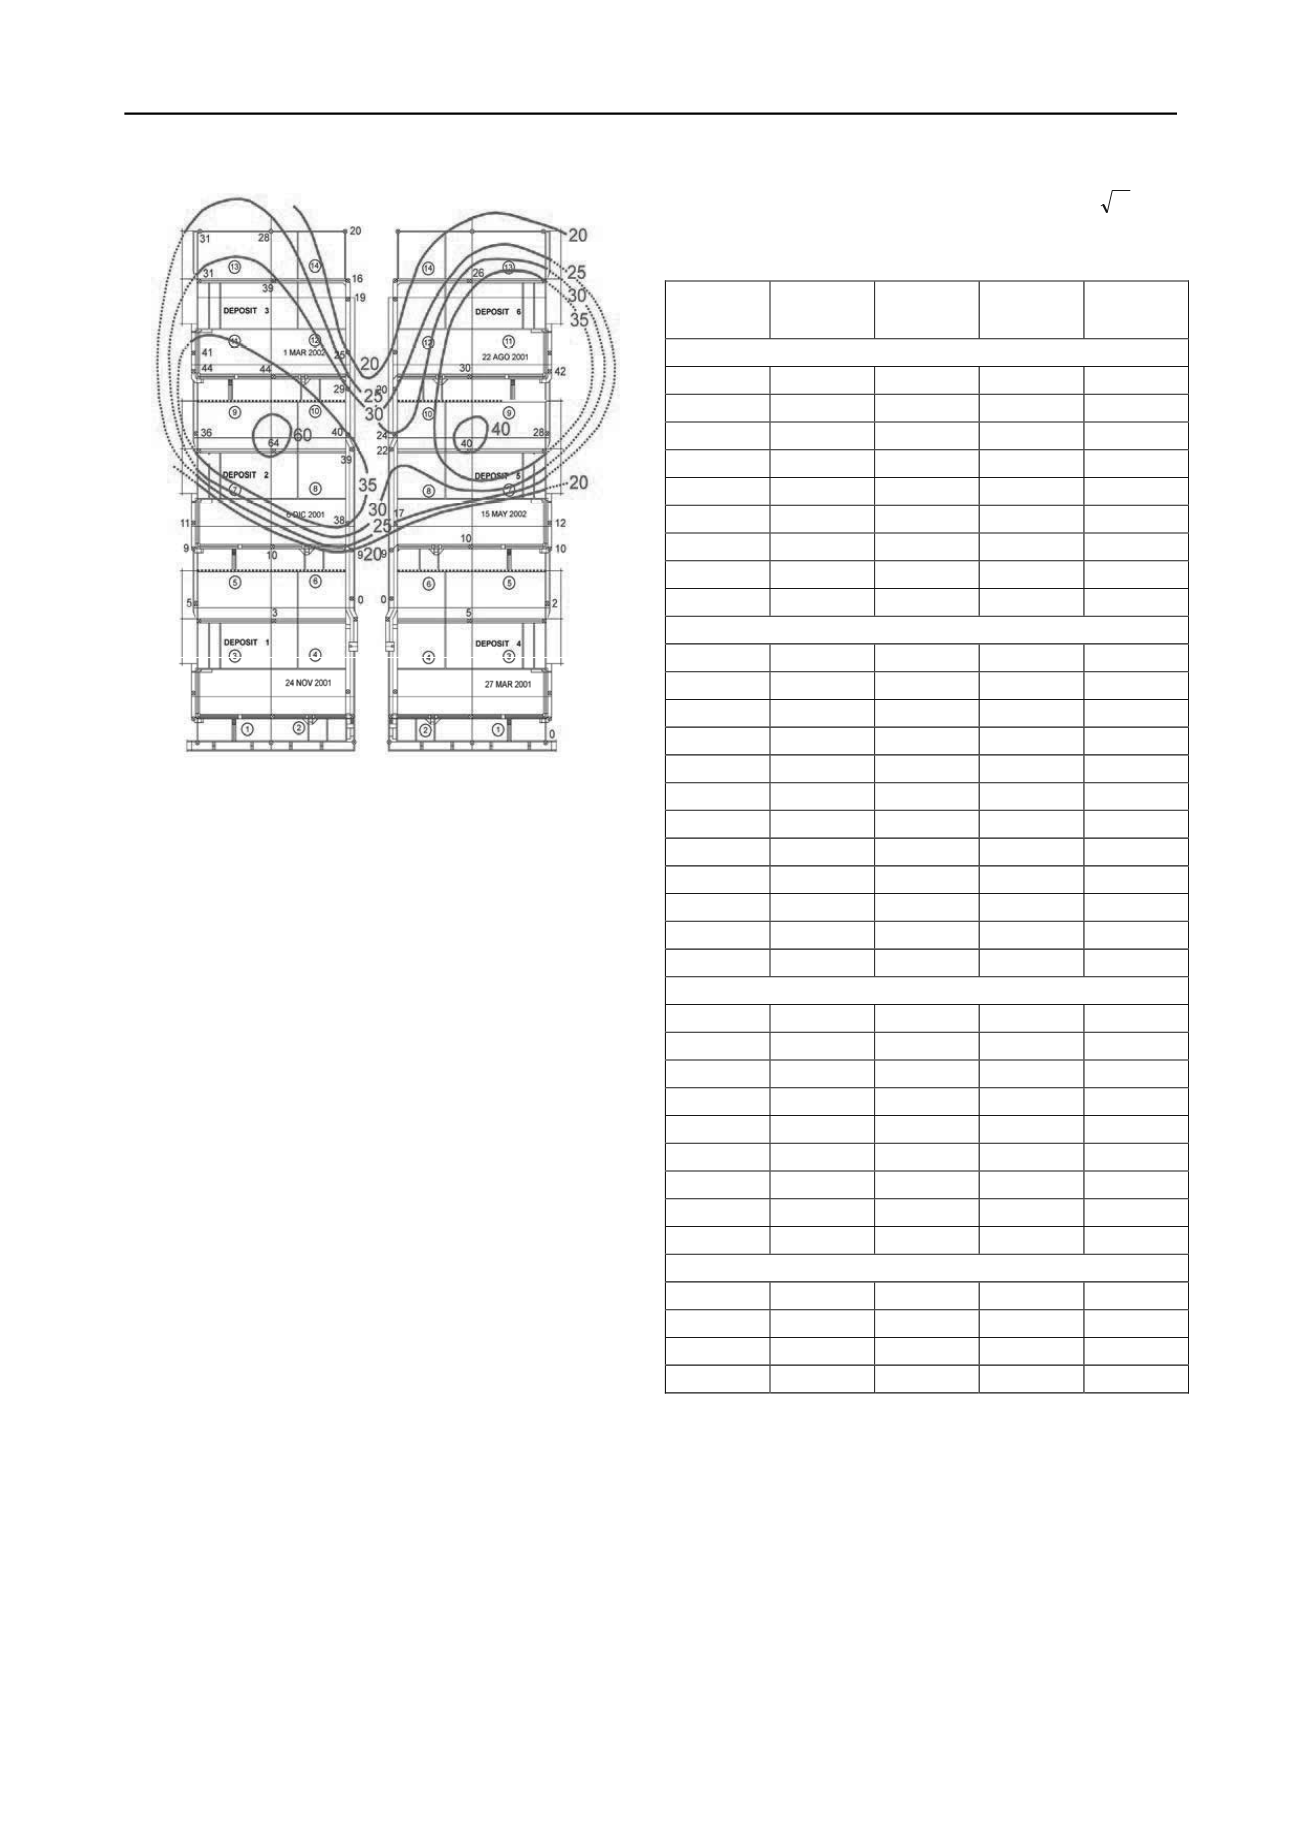
According to the values for the coefficient a, shown in Table 1,
in general, at each point the values for a
8-10
are lower than the
values for a
0.5-9
. This would seem to indicate that between 8 and
10 years after the biodigesters were first filled, there was a
period of stabilization.
Dapena, et al. (2007) compared the settlement values for
pool 5 measured after 4.5 years with the settlement values
calculated for 4.5 years, using the model adjusted using the
settlement values after 2.5 years. Except for point 8 of pool 5,
where real settlement was clearly greater than calculations
indicated, settlement at the remaining points of pool 5 matched
that calculated using the model. The settlement measured at 10
years for pool 5 is shown in Table 2, together with the
calculations. We can see that the real settlement is lower than
the calculations, confirming the stabilization process.
6 SUMMARY AND CONCLUSIONS
The phase 2 biodigesters at the Galindo Waste Water Treatment
Plant are located on a layer of silty clay between 15 and 20 m
thick, which has been subjected to irregular preloading for 20
years, with average preconsolidation pressure of 2 kg/cm
2
.
However, for the site of the phase 2 biodigesters, the
distribution of the preload was not known for certain.
Table 1. Values for coefficient a when the model s=a
ta
+ b is
adjusted using measurements between 0.5 and 9 years (a
-0.5-9
) and
measurements between 8 and 10 years (a
8-10
).
Point
a
0.5-9
a
8-10
R
2
10 8
b
0.5-9
Tank 2
40
38.5
23.7
0.96
2.4
41
38.3
24.7
0.97
-0.1
42
36.3
19.1
0.95
8.9
43
10.8
15.2
0.88
5.3
52
9.5
6.2
0.84
17.1
53
58.9
31.6
0.97
37.4
61
36.2
26.4
0.97
7.9
62
10.8
0
0.87
3.5
63
9.9
0
0.87
2.0
Tank 3
35
18.1
10.9
0.98
-6.3
36
15.0
3.9
0.92
-0.3
37
13.5
9.6
0.91
+5.6
38
-
13.6
0.92
-
39
23.7
18.0
0.91
+0.9
54
28.9
23.3
0.97
14.5
55
21.0
9.0
0.95
16.1
56
21.8
27
0.92
-1.1
57
22.4
0
0.95
-4.1
58
26.0
11.3
0.97
-1.6
59
34.9
22.7
0.98
1.3
60
36.0
26.7
0.97
1.0
Tank 5
6
7.7
6.7
0.59
7.1
7
12.7
5.9
0.70
5.8
8
35.2
29.7
0.96
8.1
16
37.5
23.3
0.97
46
17
7.8
4.4
0.08
22.0
26
7.5
2.9
0.52
6.6
27
17.5
13.6
0.92
8.3
28
22.8
15.6
0.96
8.0
29
22.8
12.0
0.96
11.6
Tank 6
9
38.3
35.8
0.95
-6
14
21.5
16.1
0.89
32.2
15
28.9
28.7
0.94
21.5
30
20.3
18.4
0.95
0.5


