3166
Proceedings of the 18
th
International Conference on Soil Mechanics and Geotechnical Engineering, Paris 2013
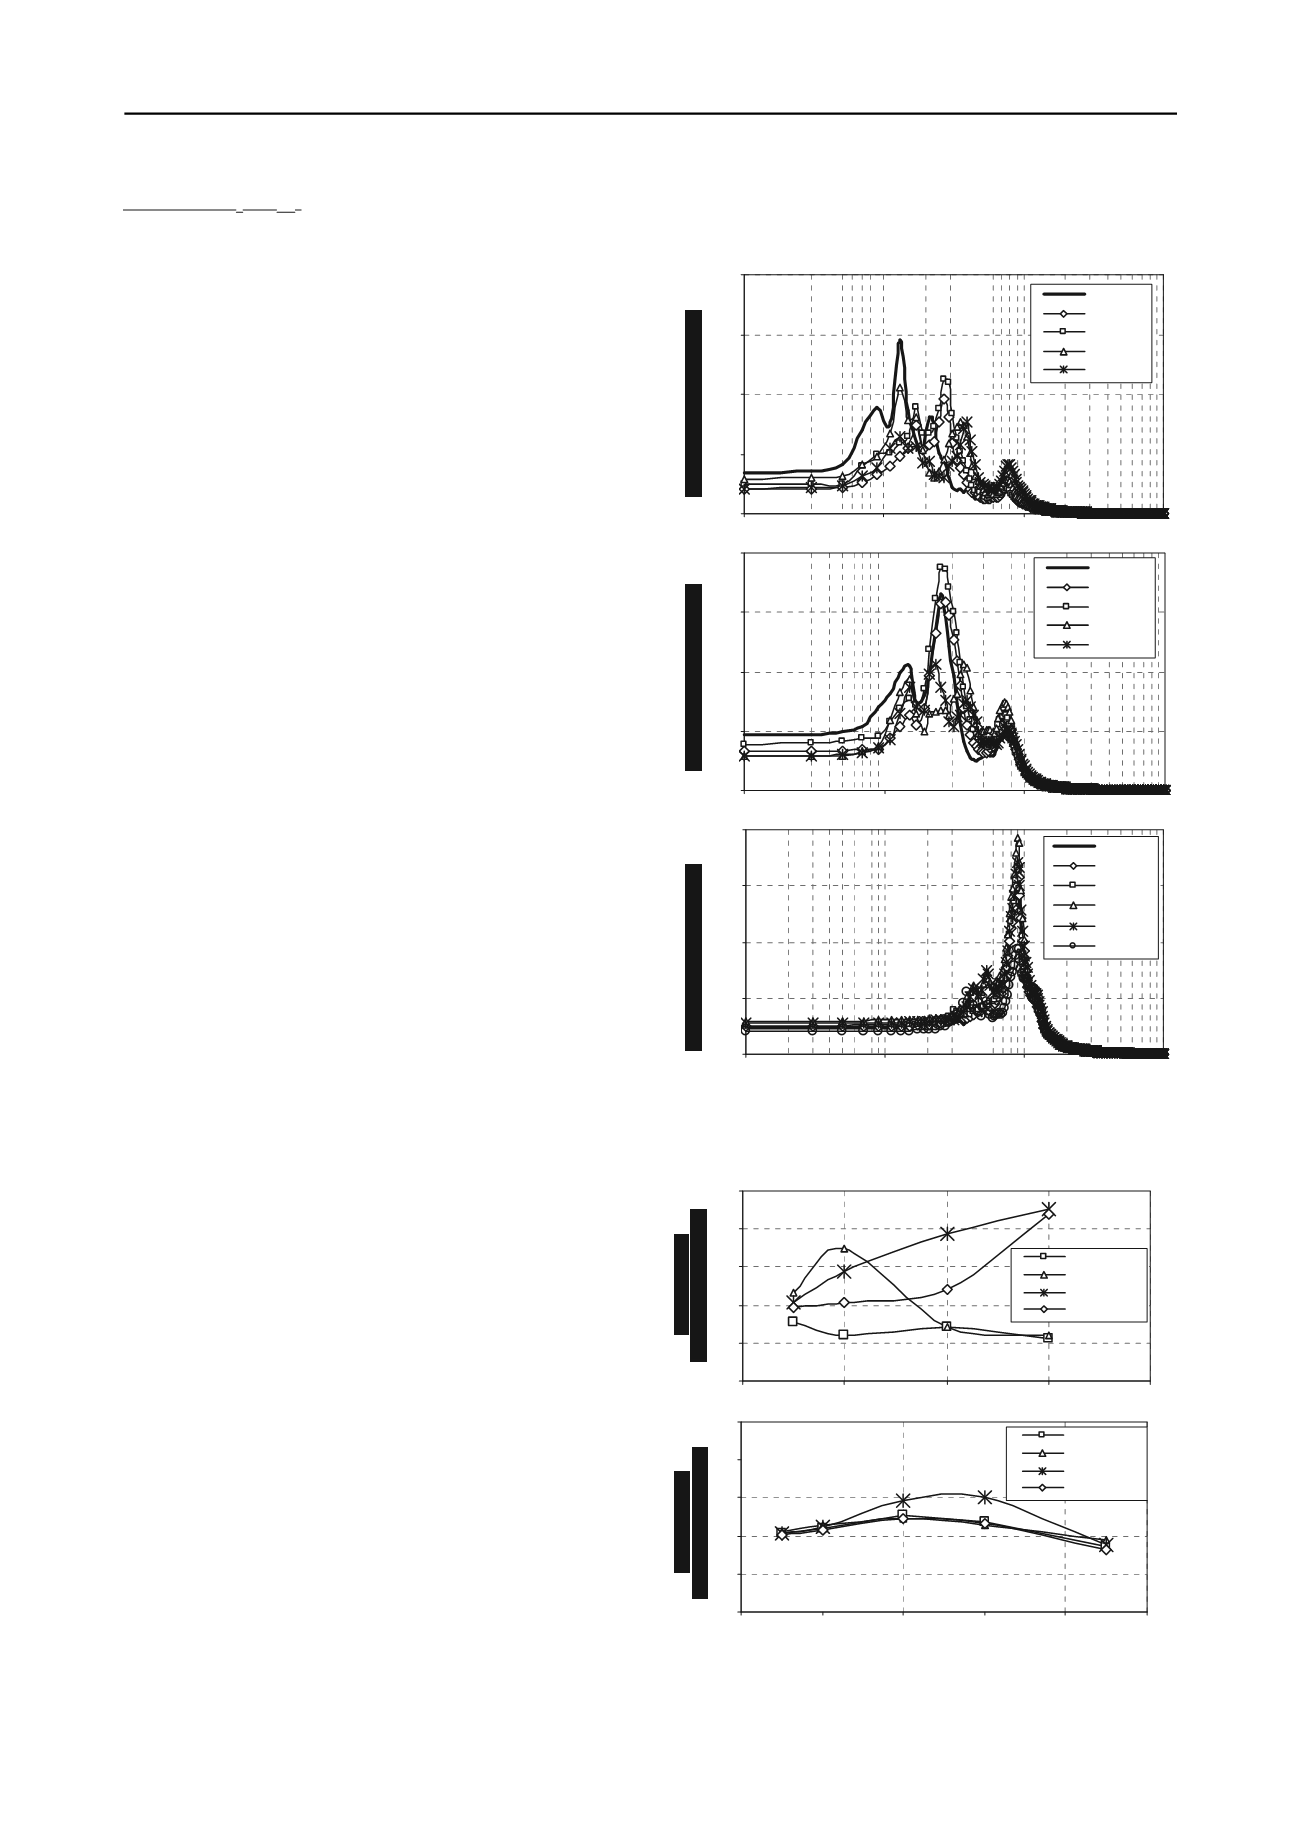
Group (2) - (T
p
> T
site
)
Increasing the thickness of the RSM layer from 1m to 4m
caused increasing in the maximum spectral acceleration
compared to the base line case. Increasing the thickness of the
RSM layer from 4m to 6m resulted in a reduction in the
maximum spectral acceleration decreased but still higher than
the maximum spectral acceleration in the base line case.
Increasing the RSM thickness to 9m resulted in reduction in the
maximum spectral acceleration equals to 38% compared to the
baseline case. Increasing the thickness of the RSM layer from
1m to 4m caused increasing in the spectral acceleration at low
and high periods compared to the base line case (Figure 7).
However, further increase in the thickness up to 9m resulted in a
reduction in the amplification factor below the baseline case.
6 CONCLUSIONS
The following main points may be concluded based on the
analyses presented herein:
o
The effect of using RSM layer is dependant on the site natural
period and the frequency content of the ground motion, while
the effective configuration of the RSM layer is subject to the
natural period of the intended structure.
o
Placing a layer of RSM resulted in increasing the site natural
period causing damping of spectral accelerations at low
periods and amplification of spectral accelerations at higher
periods compared to the baseline case.
o
The deeper the RSM layer, the larger the shift in site natural
period resulting in more effective damping and lower
response spectrum at ground surface for a wider range of
periods. Thus, the higher the natural period of the structure,
the deeper the sand/rubber layer needed to achieve damping.
o
For the same excavation depth, using a thin layer of RSM at
the bottom of the excavation is more effective in damping the
spectral accelerations at ground surface than using a thick
layer of RSM.
o
Settlements and creep in RSM layer should be studied in case
of large thickness.
o
Further investigation is needed to confirm the observation
through physical and numerical modeling for earthquakes of
different magnitude, amplitude, and frequency content.
o
Soil structure interaction needs to be further investigated to
examine the effect of the overlaying structure on the response.
7 REFERENCES
Anastasiadis, A., Senetakis, K., Pitilakis, K., Gargala, C., and Karakasi,
I. (2012)
“Dynamic Behavior of Sand/Rubber Mixtures. Part I:
Effect of Rubber Content and Duration of Confinement on Small-
Strain Shear Modulus and Damping Rat
io,” J. ASTM Int’l., 9
(2).
Bray, J. D., and Rodriguez-Marek, A. (1997). "Geotechnical Site
Categories." Proceedings First PEERPG&E Workshop on Seismic
Reliability of Utility Lifelines, San Francisco, CA.
Edil, T.B. and Bossc
her, P.J. (1994). “Engineering P
roperties of Tire
Chips and Soil M
ixtures,” Geotech
. Testing J., ASTM 17(4), pp.
453-464.
Feng, Z., and Sutter K.G. (2000). “Dynamic
Properties of Granulated
Rubber/Sand Mixtures,”
Geotech. Testing J., ASTM, Vol. 23, No.
3, September, pp. 338-344.
Ghazavi, M., (2004). “Shear
Strength Characteristics of Sand-Mixed
with Granular R
ubber,” Geotechnical and Geological Engineering,
Vol. 22, pp. 401-416.
Mavroulidou, M., Etan, O., and Suntharalingam, M. (2009).
“Mechanical
Properties of Granulated Tyre Rubber-Sand M
ixture,”
Proceedings of the 11th International Conference on Environmental
Science and Technology, Crete, Greece, 3-5 September.
Senetakis, K., Anastasiadis, A., Pitilakis, K., and Souli, A. (2012).
“Dynamic
Behavior of Sand/Rubber Mixtures. Part II: Effect of
Rubber Content on G/Go-g-DT Curves and Volumetric Threshold
Strain,” J. ASTM Int’l., 9(2).
Xu, X., Lo, S.H., Tsang, H.H., and Sheikh, M.N. (2009). “ Earthquake
Protection by Tire-
Soil Mixtures: Numerical Study,” New Zealand
Society for Earthquake Engineering Conference Proceedings,
Christchurch, New Zealand, April.
Zornberg, J.G., Cabral, A.R., and Viratj
andr, C. (2004). “Behaviour of
Tire Shred
–
Sand M
ixtures,” Canadian
Geotech. J., Vol. 41, April,
pp. 227-241.
( a) Lyt el Creek,19 70
0.0
0.5
1.0
1.5
2.0
2.5
0
2
4
6
8
RSM thickness ( m)
T = 0.1sec
T = 0.25 sec
T = 0.50 sec
T = 1.0 sec
( b) M ammot h Lake, 19 8 0
0.0
0.5
1.0
1.5
2.0
2.5
0
2
4
6
8
10
RSM thickness ( m)
T =0.1sec
T =0.25 sec
T =0.50 sec
T =1.0 sec
Figure 7. Effect of RSM thickness on spectral acceleration
( a) Lyt el Creek
0
0.02
0.04
0.06
0.08
0.01
0.1
1
10
Period ( sec)
Pure sand
h =1m
h =2m
h =4m
h =6m
( b) San Francisco
0.00
0.02
0.04
0.06
0.08
0.01
0.1
1
10
Period ( sec)
Pure sand
h = 1m
h = 2m
h = 4m
h = 6m
( c) M ammot h Lake
0.00
0.02
0.04
0.06
0.08
0.01
0.1
1
10
Period ( sec)
Pure sand
h = 1m
h=2m
h=4m
h=6m
h=9m
Figure 6. Response spectra of surface layer for variable RSM thickness
having depth (Y = 1m) to top of RSM layer
Depth (Y) = 2.0 m
Depth (Y) = 2.0 m


