3165
Technical Committee 307 /
Comité technique 307
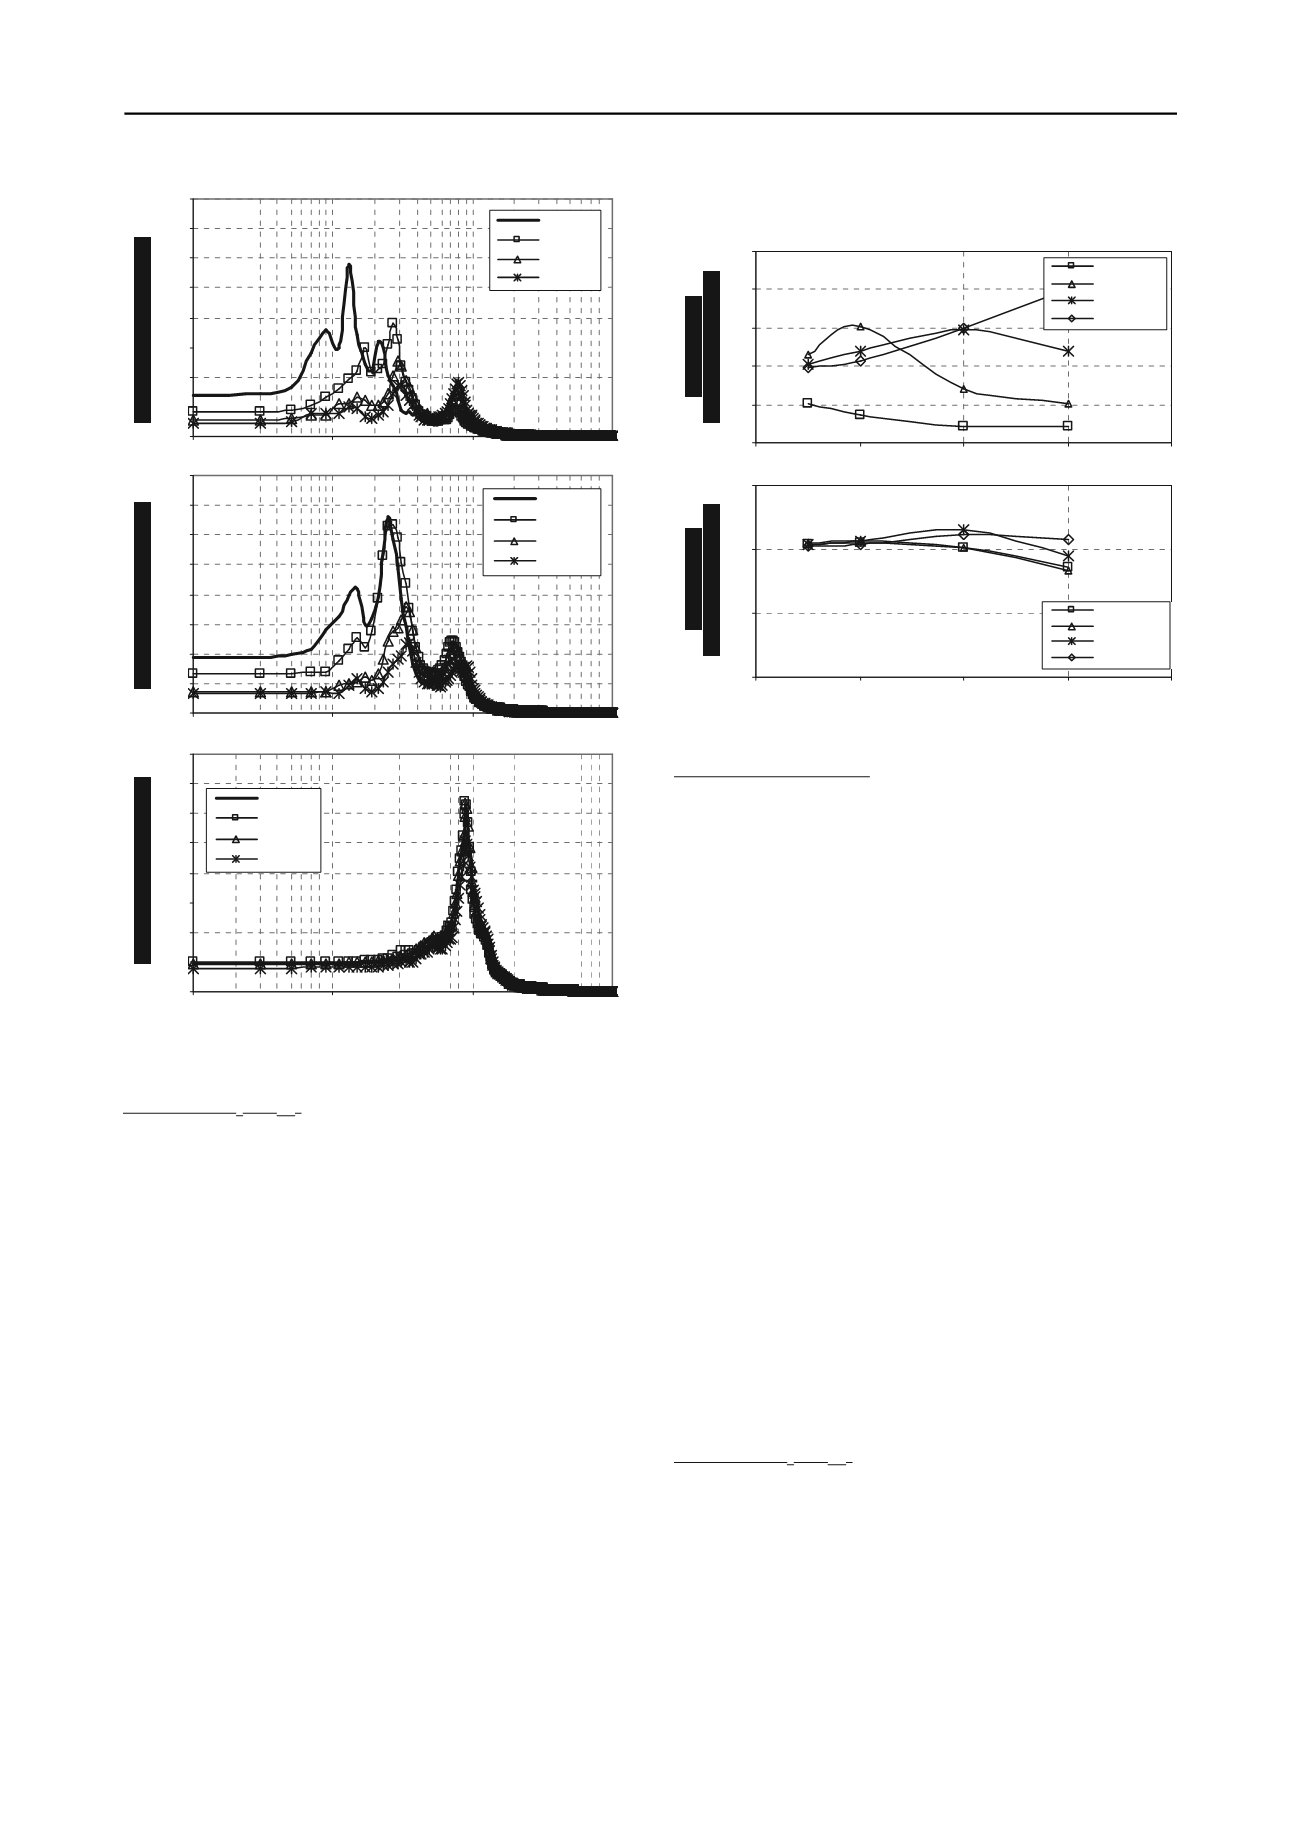
Group (1) - (T
p
< T
site
)
This group contains two earthquake ground motions, Lytel
creek and San Francisco. The response of this group due to
increasing the depth of the RSM layer is summarized below.
Because the predominant period of the ground motion is less
than the site natural period, amplification may occur at the
fundamental or at secondary order periods of the site. The
amplification factor between the spectral acceleration (Sa) at
bedrock layer and at the surface layer has a maximum value at
the fundamental period of the site. This value is reduced
strongly in the successive secondary order periods.
Placing a layer of RSM resulted in increasing the site natural
period causing shifting in the fundamental and secondary site
periods to higher periods. Shifting of the site periods leads to
maximum amplification at higher
–
more damped periods. This
resulted in damping of spectral accelerations at lower periods
and amplification of spectral accelerations at higher periods
when using RSM compared to the baseline case (pure sand).
Increasing the depth of the rubber-sand mixture layer
resulted in increasing the shifting towards the higher periods
that leads to a higher order matching between site periods and
ground motion predominant period (T
p
). Thus, increasing the
depth of the rubber-sand mixture layer resulted in highly
damped response spectra of the surface layer at lower periods
and amplification at higher periods (Figure 5). Increasing the
RSM depth to 4m resulted in reduction in the maximum spectral
acceleration reaching up to 56% to 45% in case of Lytel Creek
and San Francisco earthquakes, respectively. Placing the RSM
layer at 6m depth resulted in reduction in the maximum spectral
acceleration ranging from 71% to 64% for the case of Lytel
Creek and San Francisco earthquakes, respectively, compared to
the baseline case (Pure sand).
Group (2) - (Tp > Tsite)
This group contains only one earthquake ground motion,
which is Mammoth Lake (1980). Because the predominant
period of the ground motion is greater than the site natural
period, significant amplification does not occur neither at the
fundamental site period nor at secondary order periods.
Increasing the depth of the RSM layer resulted in insignificant
effect on the surface layer response spectrum. Placing the RSM
layer at depths 2m and 4m resulted in approximately the same
surface layer response spectrum of the baseline case (Pure
sand). Placing the RSM layer at 6m depth resulted in a small
reduction in the maximum spectral acceleration equals to 16 %
compared to the baseline case (Pure sand), and this percentage
may be slightly increased if RSM layer is put in deeper level.
B. Thickness of the rubber-sand mixture layer (h).
In this section, the numerical simulations were performed for
the baseline model (pure sand) and for another three different
models including RSM layers of varying thickness. Different
values for the thickness of the RSM layer (h) were chosen to be
2m, 4m and 6m in the models, while the depth of the top of the
RSM layer was constant at (Y=2 m) below ground surface in all
simulations. The three different input ground motions were
applied to each model. In case of Mammoth Lake earthquake,
an additional simulation was performed with an RSM layer
thickness of 9m.
The result of simulations was plotted in terms of the
response spectrum of the ground surface layer to investigate its
response to the change in the thickness of the RSM layer. Figure
(6) shows the simulation results for the three different
earthquake ground motions. Similar to the previous section, the
results can be divided into two groups as follow:
Group (1) - (T
p
< T
site
)
Increasing the thickness of the RSM layer caused decreasing
of low period spectral acceleration and also caused considerable
increasing in the high period spectral acceleration comparing by
the base line case (balancing). This is evident from the
amplification factors plotted in Figure (7) against different RSM
thicknesses for different periods. Comparing to the baseline
case (pure sand), at thickness of RSM layer equals to 6m a
reduction in the maximum spectral acceleration in cases of
Lytel Creek and San Francisco earthquakes ranged from 47% to
36%, respectively.
( a) Lyt el Creek, 19 70
0.00
0.01
0.02
0.03
0.04
0.05
0.06
0.07
0.08
0.01
0.1
1
10
Period ( sec)
Pure sand
Y =2m
Y =4m
Y =6m
( b) San Francisco, 19 57
0.00
0.01
0.02
0.03
0.04
0.05
0.06
0.07
0.08
0.01
0.1
1
10
P erio d (sec)
Pure sand
Y =2m
Y =4m
Y =6m
( c) M ammot h Lake, 19 8 0
0.00
0.01
0.02
0.03
0.04
0.05
0.06
0.07
0.08
0.01
0.1
1
10
Period ( sec)
Pure sand
Y =2m
Y =4m
Y =6m
Figure 4. Response spectra of surface layer for variable RSM depth
having thickness (h =1 m)
Figure 5. Effect of RSM depth on spectral acceleration
( a) Lyt el Creek
0.0
0.5
1.0
1.5
2.0
2.5
0
2
4
6
8
RSM dept h (m)
T = 0.1 sec
T = 0.25 sec
T = 0.50 sec
T = 1.0 sec
( b) M amoot h Lake
0.0
0.5
1.0
1.5
0
2
4
6
8
RSM dept h (m)
T = 0.1sec
T = 0.25 sec
T = 0.50 sec
T = 1.0 sec
Thickness (h) = 1.0 m
Thickness (h) = 1.0 m


