 
          3164
        
        
          Proceedings of the 18
        
        
          th
        
        
          International Conference on Soil Mechanics and Geotechnical Engineering, Paris 2013
        
        
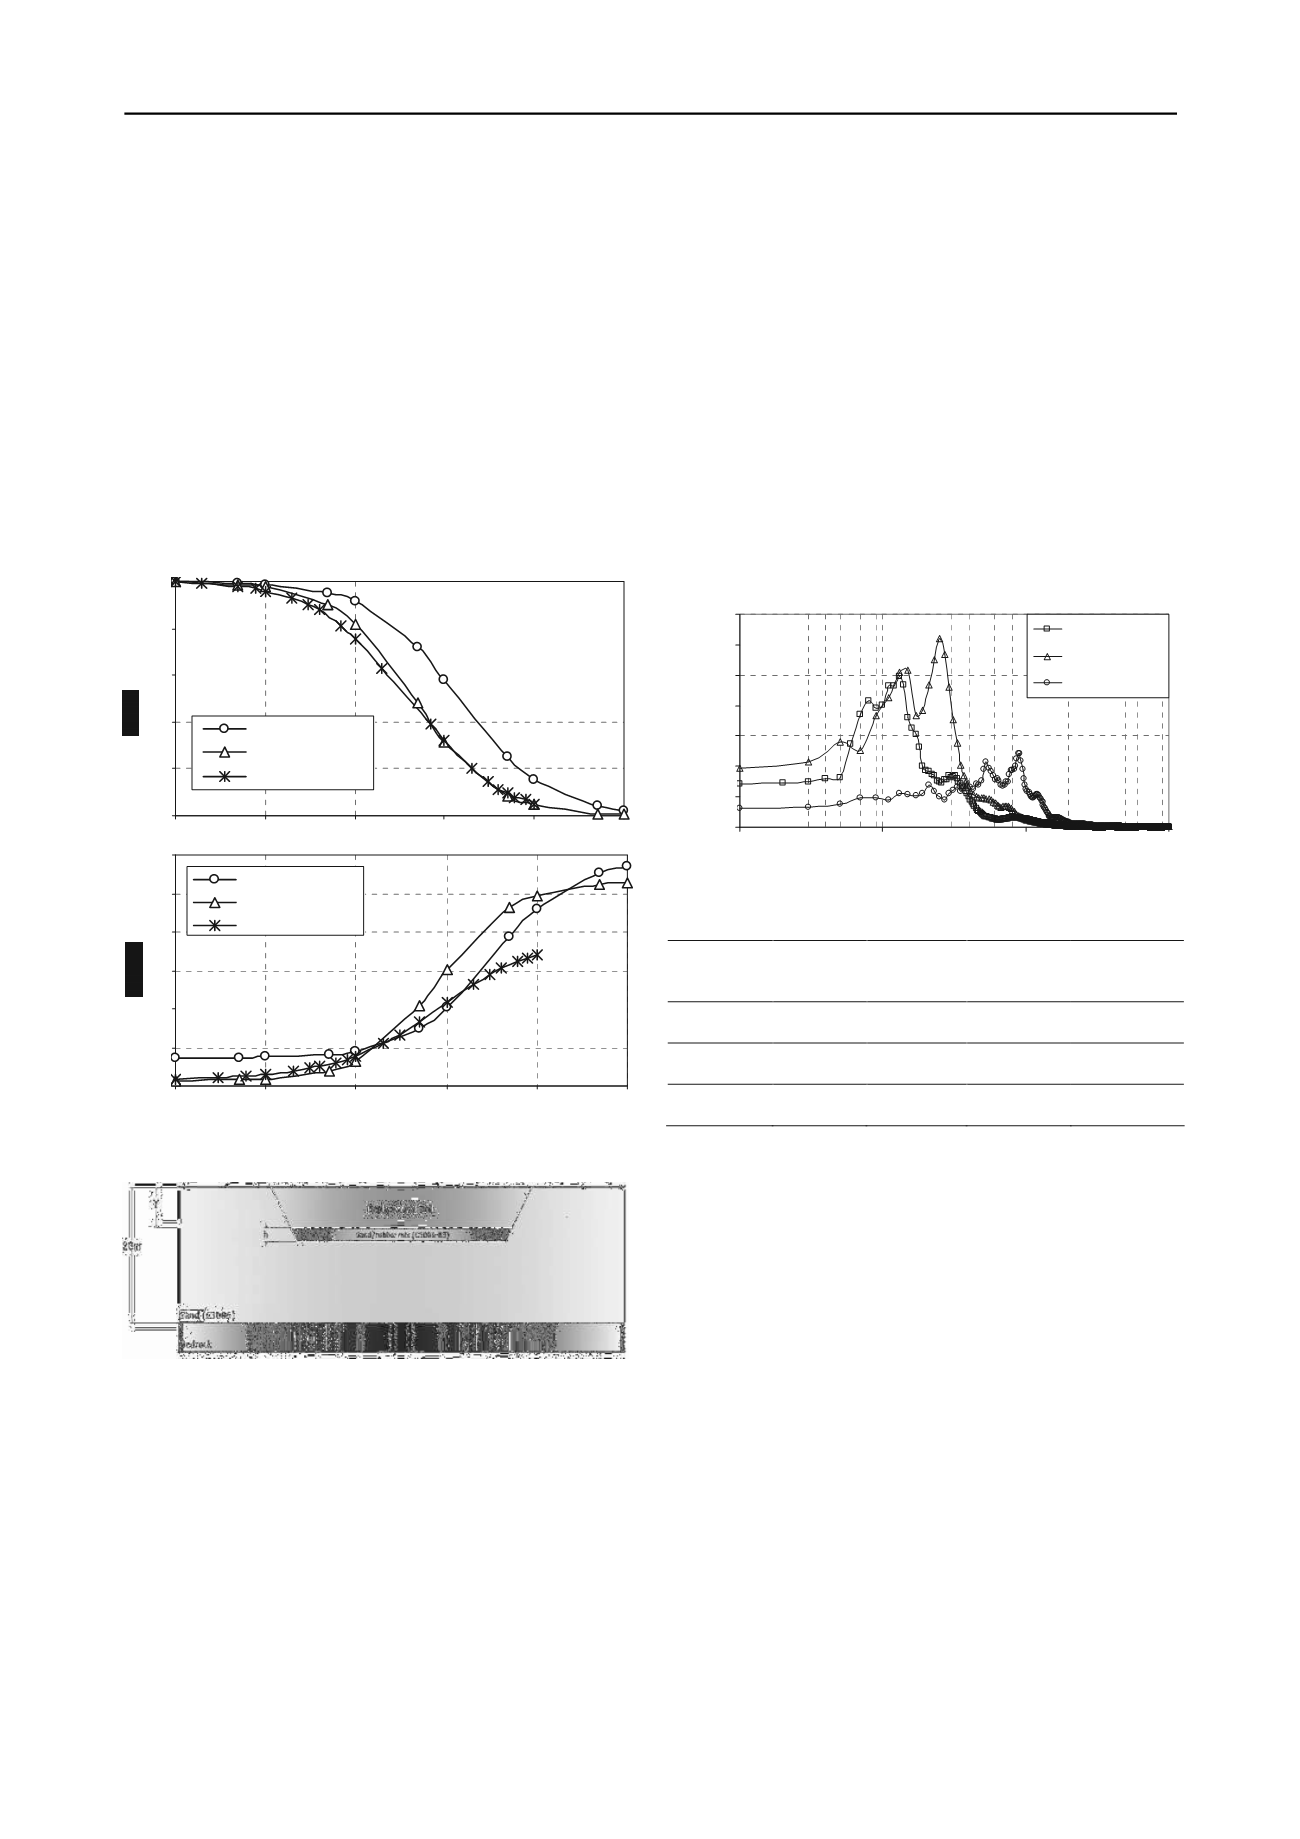
          reduction and damping curves of dry rubber-sand mixture
        
        
          (C3D06-R3), sand (C3D06), and the replacement soil at
        
        
          confining pressures (σ'
        
        
          m
        
        
          = 50 kPa) are shown in Figure 1. The
        
        
          small strain shear modulii for the sand, RSM, and replacement
        
        
          soil are 65.6 MPa, 10.4 MPa, and 234 MPa, respectively.
        
        
          3 NUMERICAL MODEL
        
        
          A number of two-dimensional finite element models were
        
        
          built in QUAKE/W to evaluate the site response during an
        
        
          earthquake. The soil was modeled using an equivalent linear
        
        
          constitutive model. The baseline case representing the untreated
        
        
          site condition constitutes a 20 m thick layer of sand above
        
        
          bedrock. Two additional layers were inserted into the original
        
        
          model to simulate replacement soil and RSM layers in the
        
        
          different numerical analyses, as shown in Figure (2). The width
        
        
          of the RSM layers was assumed 20m.
        
        
          The effect of changing the depth and thickness of the RSM
        
        
          layer and the replacement soil on top on the site response during
        
        
          earthquakes was investigated. An RSM layer 1 m thick was first
        
        
          assumed to be placed at depths of 1m, 2m, 4m, and 6m. The
        
        
          thickness of the RSM layer was then changed to 2m, 4m, and
        
        
          6m at a depth of 2m to the top of the layer.
        
        
          It is important to specify the geotechnical site category that
        
        
          helps us to determine the site natural period for the baseline
        
        
          case which consists of 20 m of pure sand above extended base
        
        
          bedrock. Site period can be obtained depending on the depth
        
        
          and characteristics of the soil deposit (Bray and Rodriguez-
        
        
          Marek, 1997). Because the sand soil deposit depth is greater
        
        
          than 6m and less than 30m, the site is classified as "Shallow
        
        
          Stiff Soil" and the site natural period will be around (0.5 sec),
        
        
          (Bray and Rodriguez-Marek, 1997).
        
        
          4 EARTHQUAKE GROUND MOTIONS
        
        
          Three earthquake ground motions of comparable magnitude
        
        
          and different frequency content were used to investigate the
        
        
          ground surface layer response in case of pure sand deposit
        
        
          (baseline case) and in cases of the existence of the RSM layer.
        
        
          The earthquake ground motions data were obtained from the
        
        
          ground motion database of the Pacific Earthquake Engineering
        
        
          Research Center (PEER). The ground motion database includes
        
        
          a very large set of ground motions recorded in worldwide
        
        
          shallow crustal earthquakes in active tectonic regimes. Figure
        
        
          (3) shows the response spectrum of earthquake input ground
        
        
          motions, and Table (2) summarizes their characteristics. The
        
        
          predominant period of the selected input ground motions varies
        
        
          between lower than the site natural period (T
        
        
          site
        
        
          = 0.5 sec) such
        
        
          as in Lytel Creek (T
        
        
          p
        
        
          = 0.08 sec) and San Francisco (T
        
        
          p
        
        
          = 0.26
        
        
          sec), and greater than the site natural period such as in
        
        
          Mammoth Lake earthquake (T
        
        
          p
        
        
          = 0.925 sec) in order to cover a
        
        
          range of frequency contents for intermediate earthquakes.
        
        
          Table (2): Earthquake ground motions characteristics


            Event Name Magnitude


            (M)


            Peak Grnd.


            Accel.


            PGA (g)


            Predominant


            Period,


            T


            p


            (sec)


            Station


          Lytel Creek
        
        
          (1970)
        
        
          5.33
        
        
          0.070
        
        
          0.130 Cedar Springs,
        
        
          Allen Ranch
        
        
          San Francisco
        
        
          (1957)
        
        
          5.28
        
        
          0.095
        
        
          0.260
        
        
          Golden Gate
        
        
          Park
        
        
          Mammoth
        
        
          Lake (1980)
        
        
          4.73
        
        
          0.031
        
        
          0.925
        
        
          USC Cash
        
        
          Baugh Ranch
        
        
          5 RESULTS AND DISCUSSION
        
        
          The influence of two parameters on the site response was
        
        
          studied, namely the depth of the rubber-sand mixture layer (Y)
        
        
          and the thickness of the rubber-sand mixture layer (h).


            A. Depth of the rubber-sand mixture layer (Y)


          The numerical simulations were performed for the baseline
        
        
          model (Pure sand) and for another three models in which a 1 m
        
        
          thick layer of RSM were placed at depths of 2m, 4m, and 6m.
        
        
          The three different input ground motions were applied to each
        
        
          model. The replacement soil on top of the RSM layer was
        
        
          modeled as a well compacted sand-gravel mixture layer with a
        
        
          unit weight of 20 kN/m
        
        
          2
        
        
          . The modulus reduction and damping
        
        
          curves for the replacement soil are shown in Figure 1. The
        
        
          thickness of the replacement soil is the same as the depth of the
        
        
          RSM layer from ground surface (Y).
        
        
          The response spectra at ground surface were plotted to
        
        
          investigate the effect of changing the depth of the RSM layer on
        
        
          the ground response. Figure (4) shows the results for the three
        
        
          earthquake ground motions. The results were divided into two
        
        
          groups. The first group is for earthquake ground motions that
        
        
          have a predominant period less than the site natural period (T
        
        
          p
        
        
          <
        
        
          T
        
        
          site
        
        
          ), i.e. Lytel Creek (1970) and San Francisco (1957)
        
        
          earthquakes. The second group is for earthquake ground
        
        
          motions that have a predominant period grater than the site
        
        
          natural period (T
        
        
          p
        
        
          > T
        
        
          site
        
        
          ), i.e. Mammoth Lake earthquake.
        
        
          0.0
        
        
          0.2
        
        
          0.4
        
        
          0.6
        
        
          0.8
        
        
          1.0
        
        
          0.0001
        
        
          0.001
        
        
          0.01
        
        
          0.1
        
        
          1
        
        
          10


            shear strain (%)


          RSM (35%)
        
        
          Sand (C3D06)
        
        
          Replacement soil
        
        
          0
        
        
          5
        
        
          10
        
        
          15
        
        
          20
        
        
          25
        
        
          30
        
        
          0.0001
        
        
          0.001
        
        
          0.01
        
        
          0.1
        
        
          1
        
        
          10


            shear strain (% )


          RSM (35%)
        
        
          Sand (C3D06)
        
        
          Replacement soil
        
        
          Figure 1. The modulus reduction and damping curves at (σ'm = 50 kPa)
        
        
          0.000
        
        
          0.005
        
        
          0.010
        
        
          0.015
        
        
          0.020
        
        
          0.025
        
        
          0.030
        
        
          0.035
        
        
          0.01
        
        
          0.1
        
        
          1
        
        
          10


            Period (sec)


            Spectral Acceleration (g)


          Lytel Creek
        
        
          San Francisco
        
        
          Mammoth Lakes
        
        
          Figure 3. Earthquake ground motions response spectrum at damping
        
        
          ratio (5%)
        
        
          Figure 2. The FEM model used in the numerical study