2313
Technical Committee 209 /
Comité technique 209
5 RESULTS AND DISCUSSION
5.1 2D Analyses
The accuracy of the 2D FE model was verified by computing
the uniaxial vertical capacity and comparing with results
published in the literature. An interface factor at the
mudmat/soil interface
= 1 was assumed for this comparison.
A normalized vertical capacity V
ult
/s
uo
B = 10.45 was found.
This compares well with the analyses results published by
Salgado (2008) who found 10.42 using ABC program (Martin,
2004). When the interface factor is reduced to
= 0.5, the
vertical capacity V
ult
/s
uo
B reduces to 9.8.
The MH failure envelope for the case without pug mark is
shown on Figure 3 assuming a vertical load V so that v = 0.4,
which is equivalent to a safety factor of 2.5 on the uniaxial
vertical capacity. The results are plotted in a non-dimensional
way: M/s
uo
B² versus H/s
uo
B. This case is for an inter-distance
d = 2 m (i.e. d/B = 0.07).
0
0.2
0.4
0.6
0.8
1
1.2
1.4
0
0.1
0.2
0.3
0.4
0.5
0.6
M/S
u0
B² [-]
H/S
u0
B [-]
v=0,4 - No pug mark
v=0,4 - Pug mark
v=0,71 - Pug mark
LS:GEO verification
Figure 3. Influence of pug mark on MH failure envelope
A few comparison runs were performed with Limitstate:Geo
v2 (Limistate, 2009). Limitstate:Geo is designed to analyze the
ultimate limit (or “collapse”) state for a wide variety of
geotechnical problems. The current version is however limited
to 2D plane strain analyses. The ultimate limit state is
determined using the Discontinuity Layout Optimization (DLO)
algorithm (Smith & Gilbert, 2007). The agreement with the FE
results is found to be excellent.
The effect of the pug mark on the MH failure envelope is
significant. The normalized uniaxial vertical capacity V
ult
/s
uo
B
is reduced to 5.5 leading to a mobilisation ratio v = 0.71 instead
of 0.4 (i.e. a safety factor of 1.4 instead of 2.5). The moment
capacity is reduced by 55% to 80% depending on the applied
horizontal load.
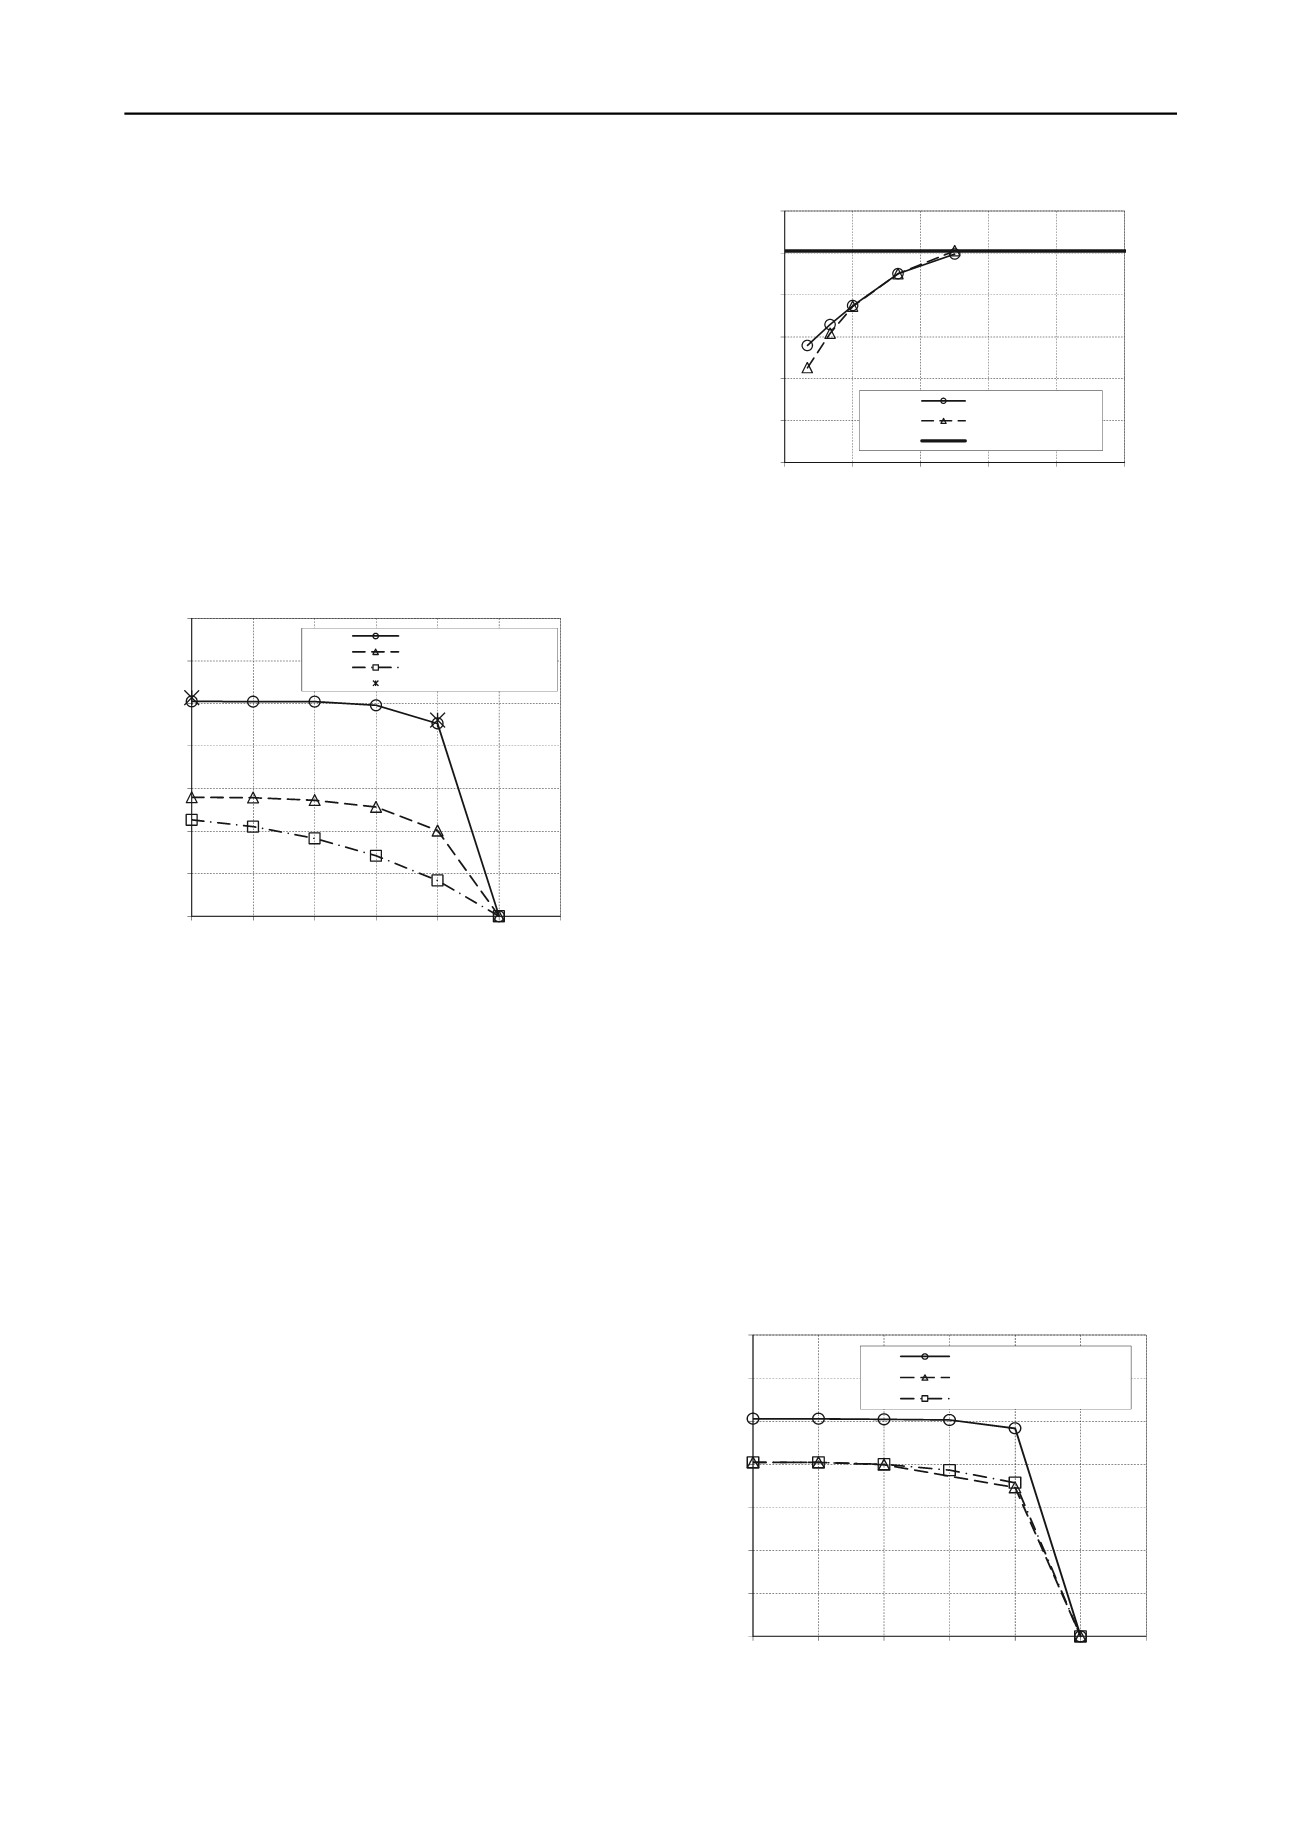
The inter-distance between the mudmat and the pug mark
was then progressively increased and results are presented on
Figure 4. The maximum moment capacity increases
progressively with the inter-distance towards the capacity
obtained for the case without a pug mark. From an inter-
distance d/B = 0.2, the difference in mobilisation ratio of the
vertical capacity does not affect the maximum moment capacity
and, at an inter-distance d/B = 0.5, the pug mark has no effect at
all.
0.0
0.2
0.4
0.6
0.8
1.0
1.2
0
0.2
0.4
0.6
0.8
1
M/S
u0
B² [-]
Inter-distance d/B [-]
V=0.4Vult - 2D
V=V0 - 2D
No pugmark
Figure 4. Influence of pugmark / mudmat inter-distance on maximum
moment capacity – 2D analyses
5.2 3D Analyses
The accuracy of the 3D FE model was also checked by
computing the uniaxial vertical capacity for a square footing
resting on soft clay, with s
u
constant with depth and
= 1, and
comparing with available literature results. A normalized
vertical capacity V
ult
/s
uo
B² = 5.96 was found. This compares
well with the results published by Gourvenec et al. (2006) who
found 6.02. When the interface factor is reduced to
= 0.5 and
s
u
increases with depth (as defined in Section 2), the vertical
capacity V
ult
/s
uo
B² is about 9.1, which is slightly lower that the
2D plane strain capacity.
Similarly to the 2D plane strain FE analyses, the MH failure
envelope for the case without a pug mark assumes a vertical
load V so that v = 0.4. As discussed above and shown on
Figure 1, the 3D analyses consider two positions for the pug
mark: along the width and at the corner of the mudmat. The
results are plotted on Figures 5 and 6 for the first and second
positions, respectively, using the following non-dimensional
groups: M/s
uo
B³ and H/s
uo
B². This case is for an inter-distance
d = 2 m (i.e. d/B = 0.07). The moment capacity is not affected
for small mobilisation ratios of the horizontal capacity.
However, when H/s
uo
B approaches 0.5, the failure mechanism
switches rapidly from a general shear mechanism to a sliding
mechanism.
For the first position (along the width), the effect of the pug
mark on the MH failure envelope is noticeable but not as
significant as for the 2D plane strain simulations. The
normalized uniaxial vertical capacity V
ult
/s
uo
B² is reduced to
only 8.4 leading to a mobilisation ratio v = 0.44 instead of 0.4
(i.e. a safety factor of 2.29). The moment capacity is reduced by
20% to 28% depending on the applied horizontal load. There is
very little difference in the results between a vertical
mobilisation factor of 0.4 and 0.44 (Figure 5).
0.0
0.2
0.4
0.6
0.8
1.0
1.2
1.4
0
0.1
0.2
0.3
0.4
0.5
0.6
M/S
u0
B³ [-]
H/S
u0
B² [-]
v=0,4 - No pug mark - 3D
v=0,44 - Pug Mark - 3D
v=0,4 - Pug Mark - 3D
²
Figure 5. Influence of pug mark on MH failure envelope – Position 1
(along width of mudmat)


