1772
Proceedings of the 18
th
International Conference on Soil Mechanics and Geotechnical Engineering, Paris 2013
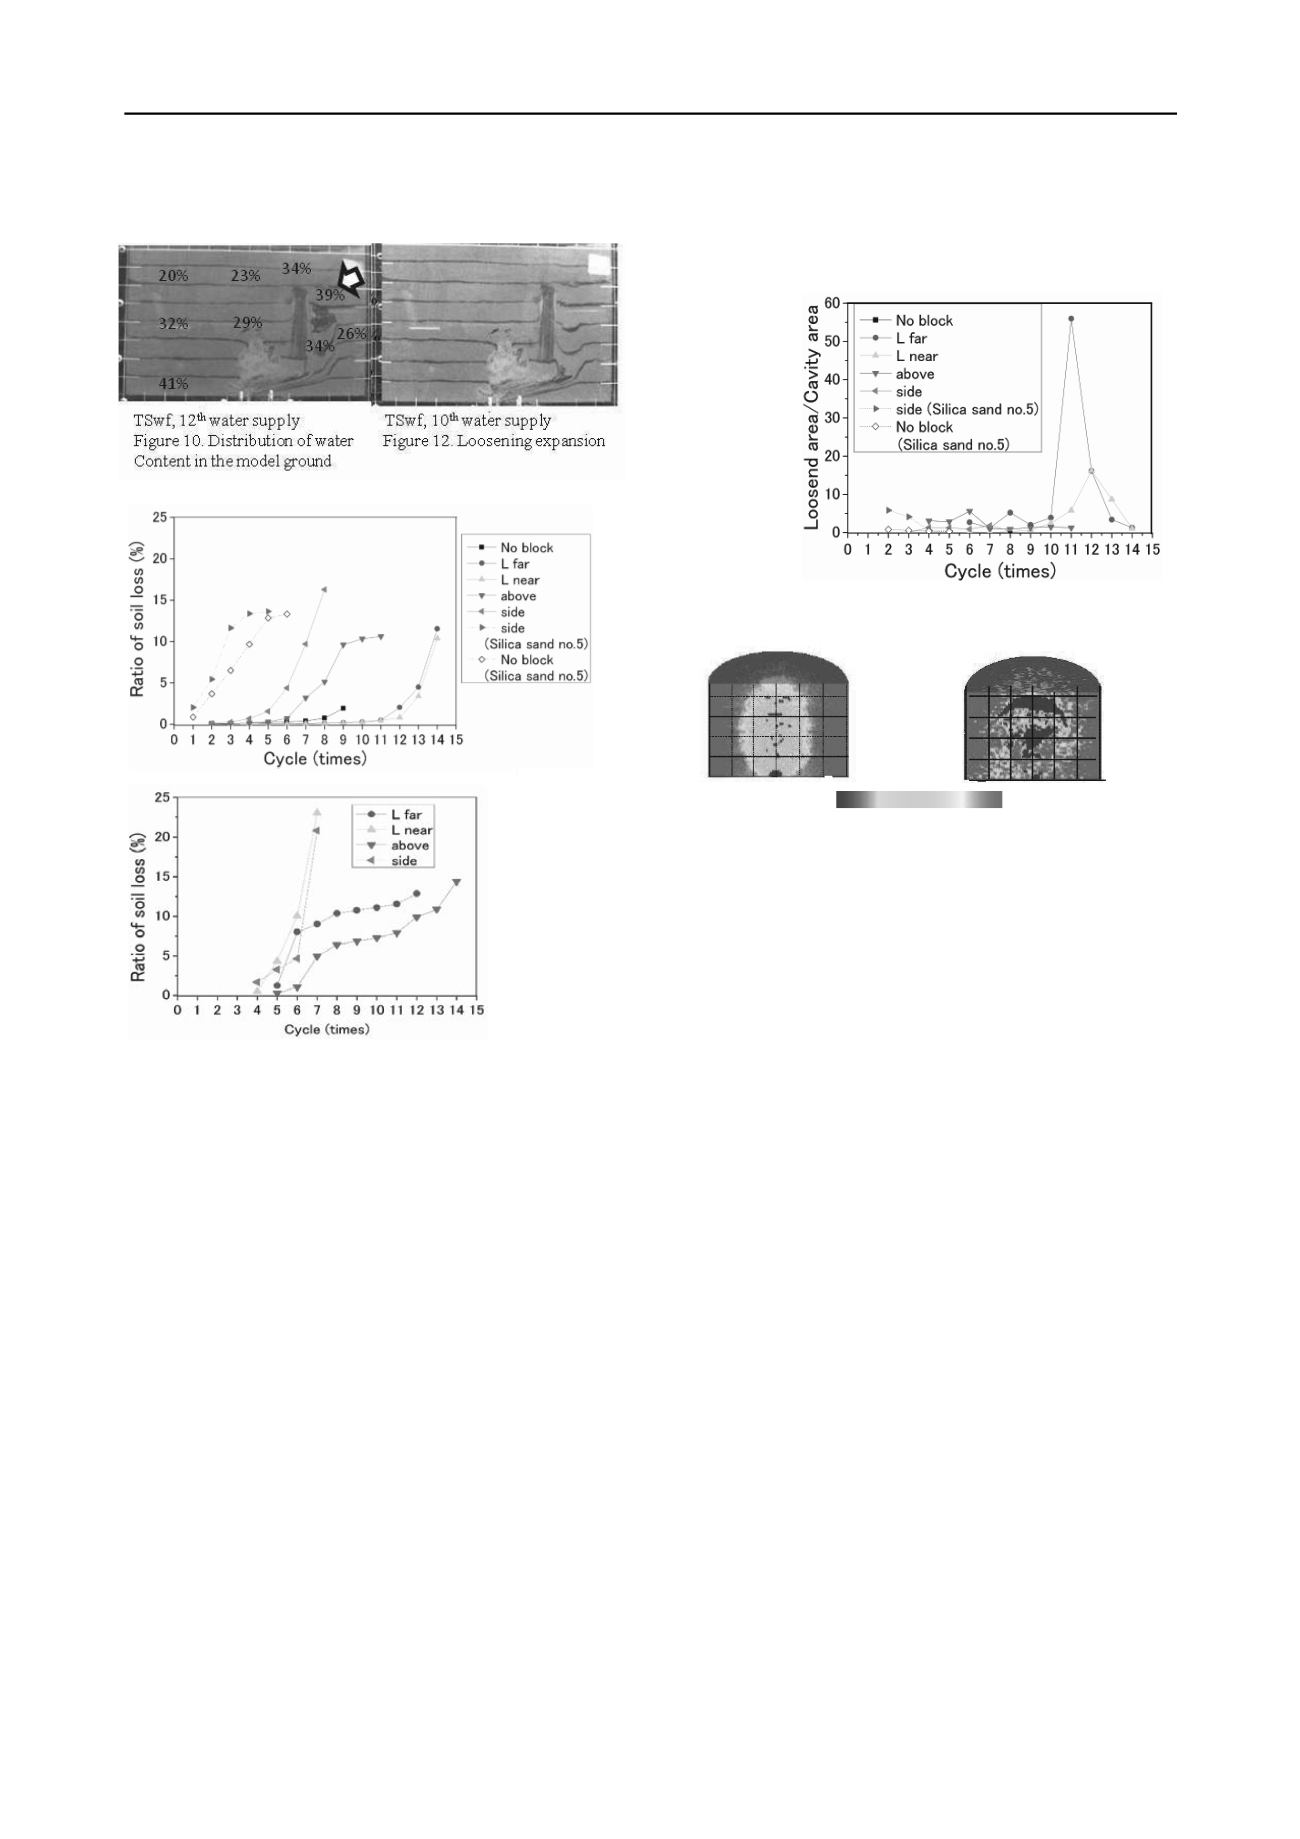
soil loss was larger in the all cases with block than that without
the block.
5 DISCUSSION ABOUT PROCESS OF THE CAVITY
AND LOOSENING EXPANSION
Loosening (low density area) was often generated around the
cavity.
(1
Deformed area around the cavity was observed in
LfarTSw test case by colored sand layers, which was
represented in Figure 12. Later this deformed area became the
cavity as observed in Figure 10. It was obvious that soil outflow
from the cavity area. However, measured soil loss was not
equivalent to that from the cavity. It was proposed that this
phenomenon was caused by two different processes: 1)
expansion of loosening, and 2) soil loss from loosening area.
In the process of 1) expansion of loosening, it was supposed
that expansion of loosening caused cavity’s shrinkage. Area of
loosening and area of cavity was estimated from photographs
taken during the tests and then ratio of loosening area to cavity
area was calculated. As shown in Figure 13, ratio increased
rapidly and then decreased. The test cases which the block was
set at Lfar and Lnear positions, the ratio increased much more
than other cases. This process easily happened in clean uniform
materials such as Toyoura sand and Silica sand no.5. Renuka et
al.(2011) evaluated the stiffness of loosening by cone
penetration test and found that penetration resistance decreased
in loosening area
3)
.
In the second process, it was suggested that fine particles
were flown out from loosening. This process was caused in well
graded materials. (Referring to 3.2) Kenny et al.(1985).
suggested that particles which were larger than four times of
fine particles were necessary for this process.
4)
Mukunoki et
al.(2007)
5)
revealed by CT scanner that formation of loosening
was different from Toyoura sand and natural sand(Referring to
Figure 13), because Toyoura sand was clean uniform sand but
natural sand was well graded sand.
<Opening>
6 CONCLUSION
This paper suggested that the placement of block in the model
ground changed water penetration and sometimes promoted
expansion of the cavity. In addition, gaps between buried
structures and the ground had higher water permeability than
that in the normal ground. The increase of water permeability
and concentration of water penetration around underground
structures may be caused in the practical ground. Two different
processes of generation of loosening are proposed.
7 REFERENCES
1) Kuwano, R, Yamauchi, K., Horii, T. & Kohashi, H.
(2006).Defects of sewer pipes causing cave-in’s in the road.
Proc. of 6th International Symposium on New Technologies
for Urban Safety of Mega Cities in Asia. Phuket: No.H63.
2) Sato, M. & Kuwano, R. (2010).
Model Tests for the
Evaluation of Formation and Expansion of a Cavity in the
ground
. Proc. of the 7th International Conference on Physical
Modelling in Geotechnics Zurich: 581-586.
3) Renuka,S. & Kuwano,R. (2011).
Formation and evaluation
of loosened ground above a cavity by laboratory model test
with uniform sand
, Proc. of 13th International Summer
Symposium, Uji, Japan: .211- 214.
4) Kenny,T.C.,Lau.D. (1985). Internal Stability of granular
filters.
Canadian Geotechnical Jornal
Volume 22:215-225.
5) Mukunoki, T., Otani, J. & Kuwano, R. (2007).
Visualization
of cavity generation in soils on sewerage defects using X-ray
CT,
Proc. of the 13th Asian Regional Conference on Soil
Mechanics and Geotechnical Engineering, Kolkata,
India, :485-488.
Figure 11.Cumulative ratio of soil loss in each water
<Side wall >
Figure 12. Evaluation of loosening
60 40 20 0 20 40 60 (mm)
80
60
40
20
0
FIGURE 13. Measurement of loosening and cavity by CT scanner,
Mukunoki et al.(2007)
5)
)
<NATURAL >
<TOYOURA>
60 40 20 0 20 40 60
80
60
40
20
0
(mm)
CT-Value
0 100 200 300 400 500


