1767
Technical Committee 204 /
Comité technique 204
Table 2. Liners properties
Stage Liner
Type of
element
f'
c
MPa
F
R
E
MPa
e
m
EA
MN/m
EI
MNm
2
/m
1 y 2 Primary Cluster 35 0.2 1.00 5,206 0.4 ----
----
Primary Cluster 35 0.2 0.57 2,968 0.4 ----
----
Secondary Plate 50 1.0 0.57 17,152 0.4 6,003 61.3
3 y 4
MPa
f
, F E
c
R
400 4
= liner reduction factor of stiffness
f’
c
= concrete axial unconfined strength
F
R
= reduction modulus due to plastic flow
E
= modulus of elasticity
e
= liner thickness
I
= modulus of inertia
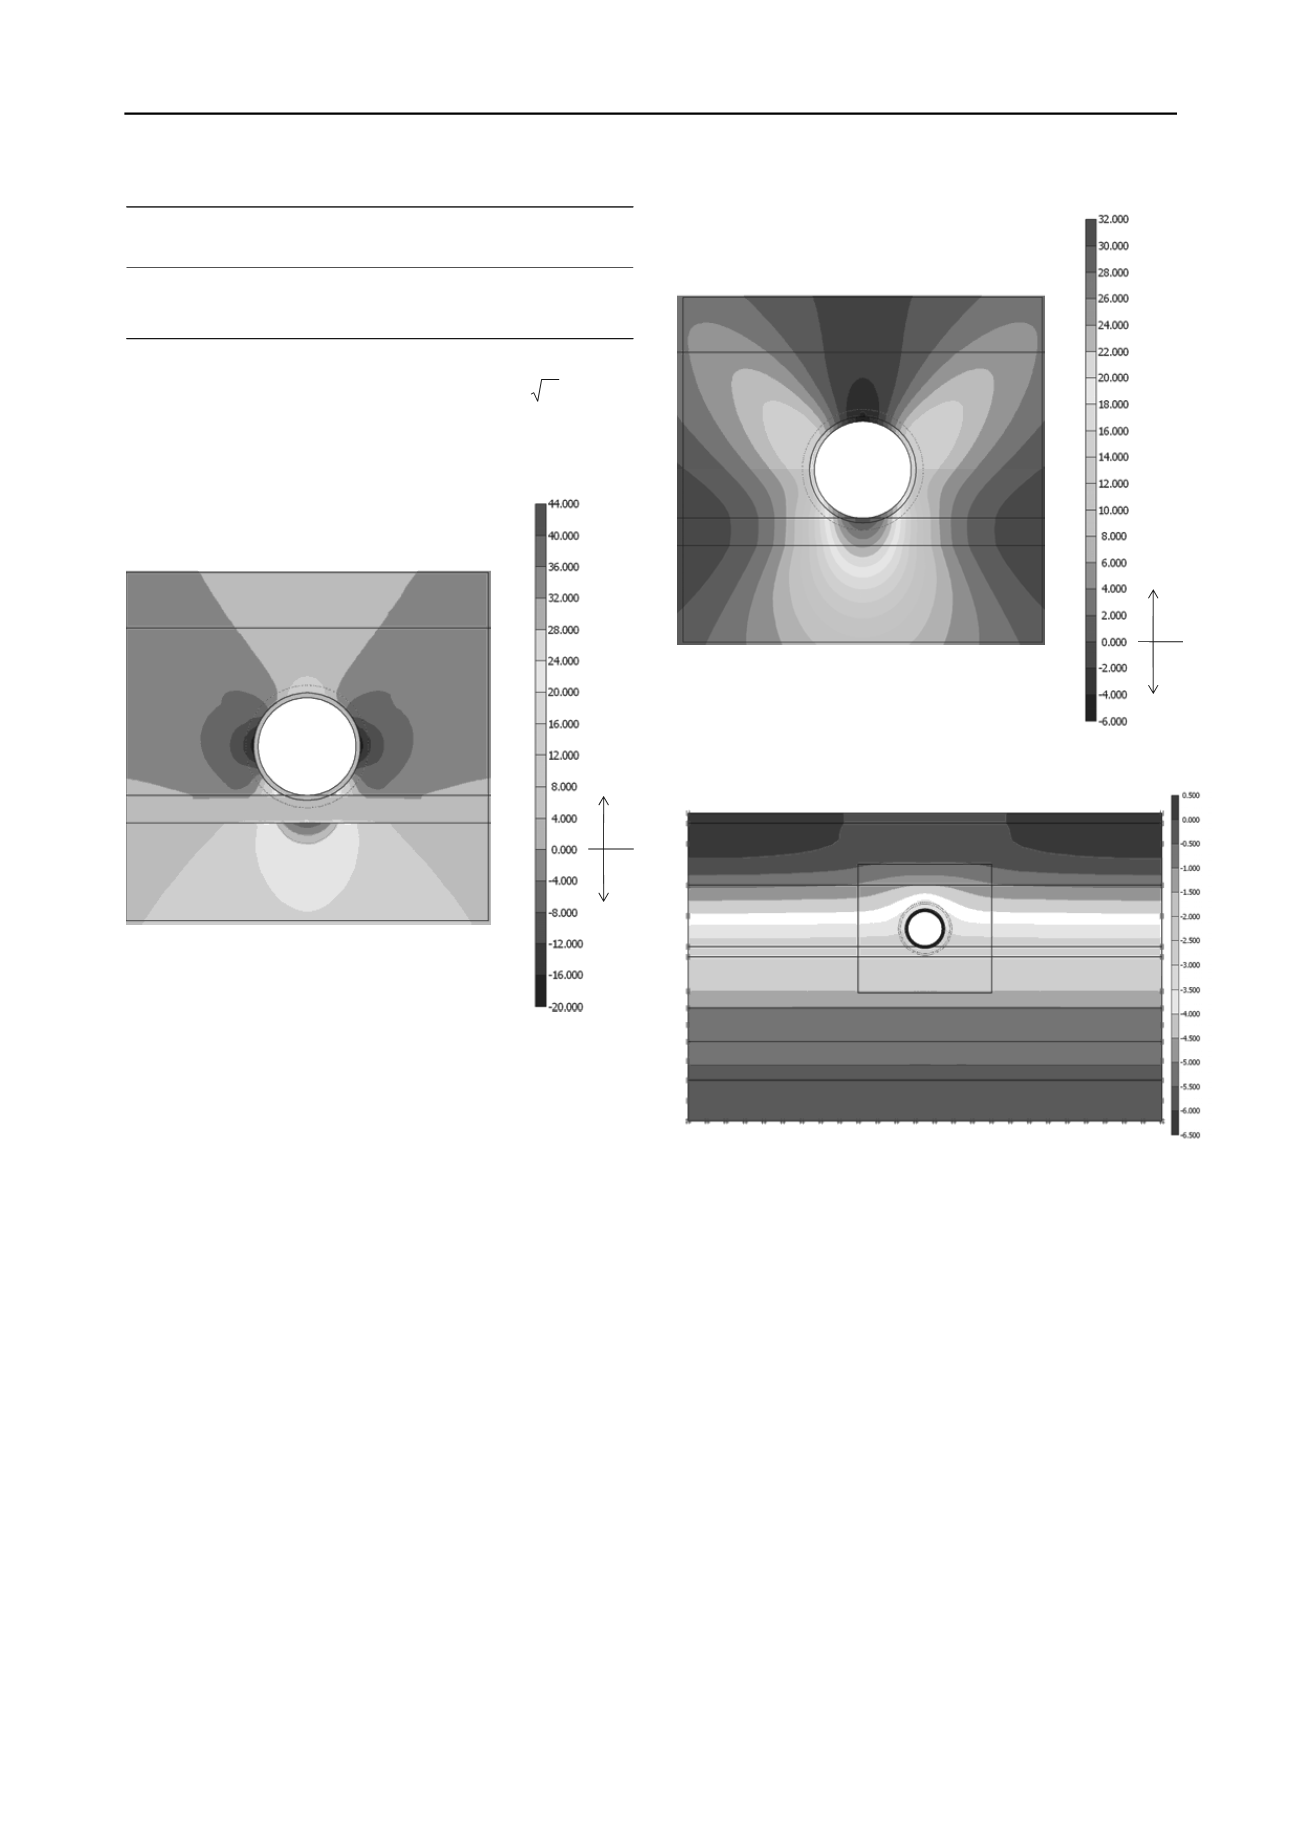
(-) Loading
(+) Unloading
[kN/m
2
]
Figure 3. Stage 1, excess of pore pressure
Once the excess of pore pressure is dissipated (stage 2),
effective stresses increase in the soil located below the tunnel.
The clayey soil in this zone becomes a pre-consolidated
material and therefore is less compressible than the soil around
it. Because of that, once the definitive liner is installed (stage 3)
and the excess of pore pressure generated by the water pressure
drawdown is allowed to dissipate (stage 4), the rate of
subsidence of the soil underneath the tunnel decreases (Figure
5). Therefore, the tunnel experiences an apparent emersion with
respect to the surrounding soil.
Such emersion causes the soil around the tunnel to hang
from the primary liner, generating negative skin friction over its
upper part and inducing development of limit stress conditions
in some areas (Figure 6). The forces that try to make the tunnel
move downward induce, in turn, significant upward reaction
forces and some plastification in the hard layer (support layer).
The analysis results show that the final liner is subjected to a
very unfavourable loading condition from a structural point of
view (Figure 7). While the upper part of the tunnel (point A) is
loaded in vertical direction, the lateral sides (point B)
experience confinement loss. This decrease of the horizontal
stress can be estimated in a simple way by applying Terzaghi’s
effective stresses principle, that is:
0
1
K u
x
(1)
where:
x
, is the total horizontal stress increment;
u,
is the
pore pressure increment and
K
0
, is the coefficient of earth
pressure at rest.
(-) Downward
(+) Upward
[*10
-3
m]
Figure 4. Stage 1, vertical displacements
[m]
Figure 5. Stage 4, vertical displacements
The total stress increment at point A has to be zero as a
result of the drawdown of pore pressure (
y
= 0). Variations
of the total stresses with respect to the amount of piezometric
drawdown at points A and B are displayed on Figure 7. This
figure also presents, for comparative purposes, the results
obtained from finite element modelling.
It can be observed that the total stress at point A estimated
with FEM increases as piezometric drawdown develops. This
can be explained by the fact that the tunnel settles at a lower
rate than the surrounding soil (apparent emersion). Hence, the
soil above the tunnel’s upper part pushes the liner downward,
increasing the vertical stress in this area.
Regarding the horizontal stress (Point B), a significant
difference can be observed between theoretical and FEM
solutions for a zero drawdown. This can be explained by the
fact that during the tunnel excavation stage the primary liner
tends to push laterally the soil located in the side zones,
generating an increment of the horizontal stresses. As the
piezometric drawdown takes place, the FEM solution gets
closer to the theoretical one. It is possible to conclude that the
theoretical solution can be used with confidence for determining
the decrement of the horizontal stresses (confinement loss) on
the sides of the tunnel as a result of pore pressure reduction.
This is not the case for the stress increment that develops on the
tunnel upper part. Differences between both solutions can be


