 
          1766
        
        
          Proceedings of the 18
        
        
          th
        
        
          International Conference on Soil Mechanics and Geotechnical Engineering, Paris 2013
        
        
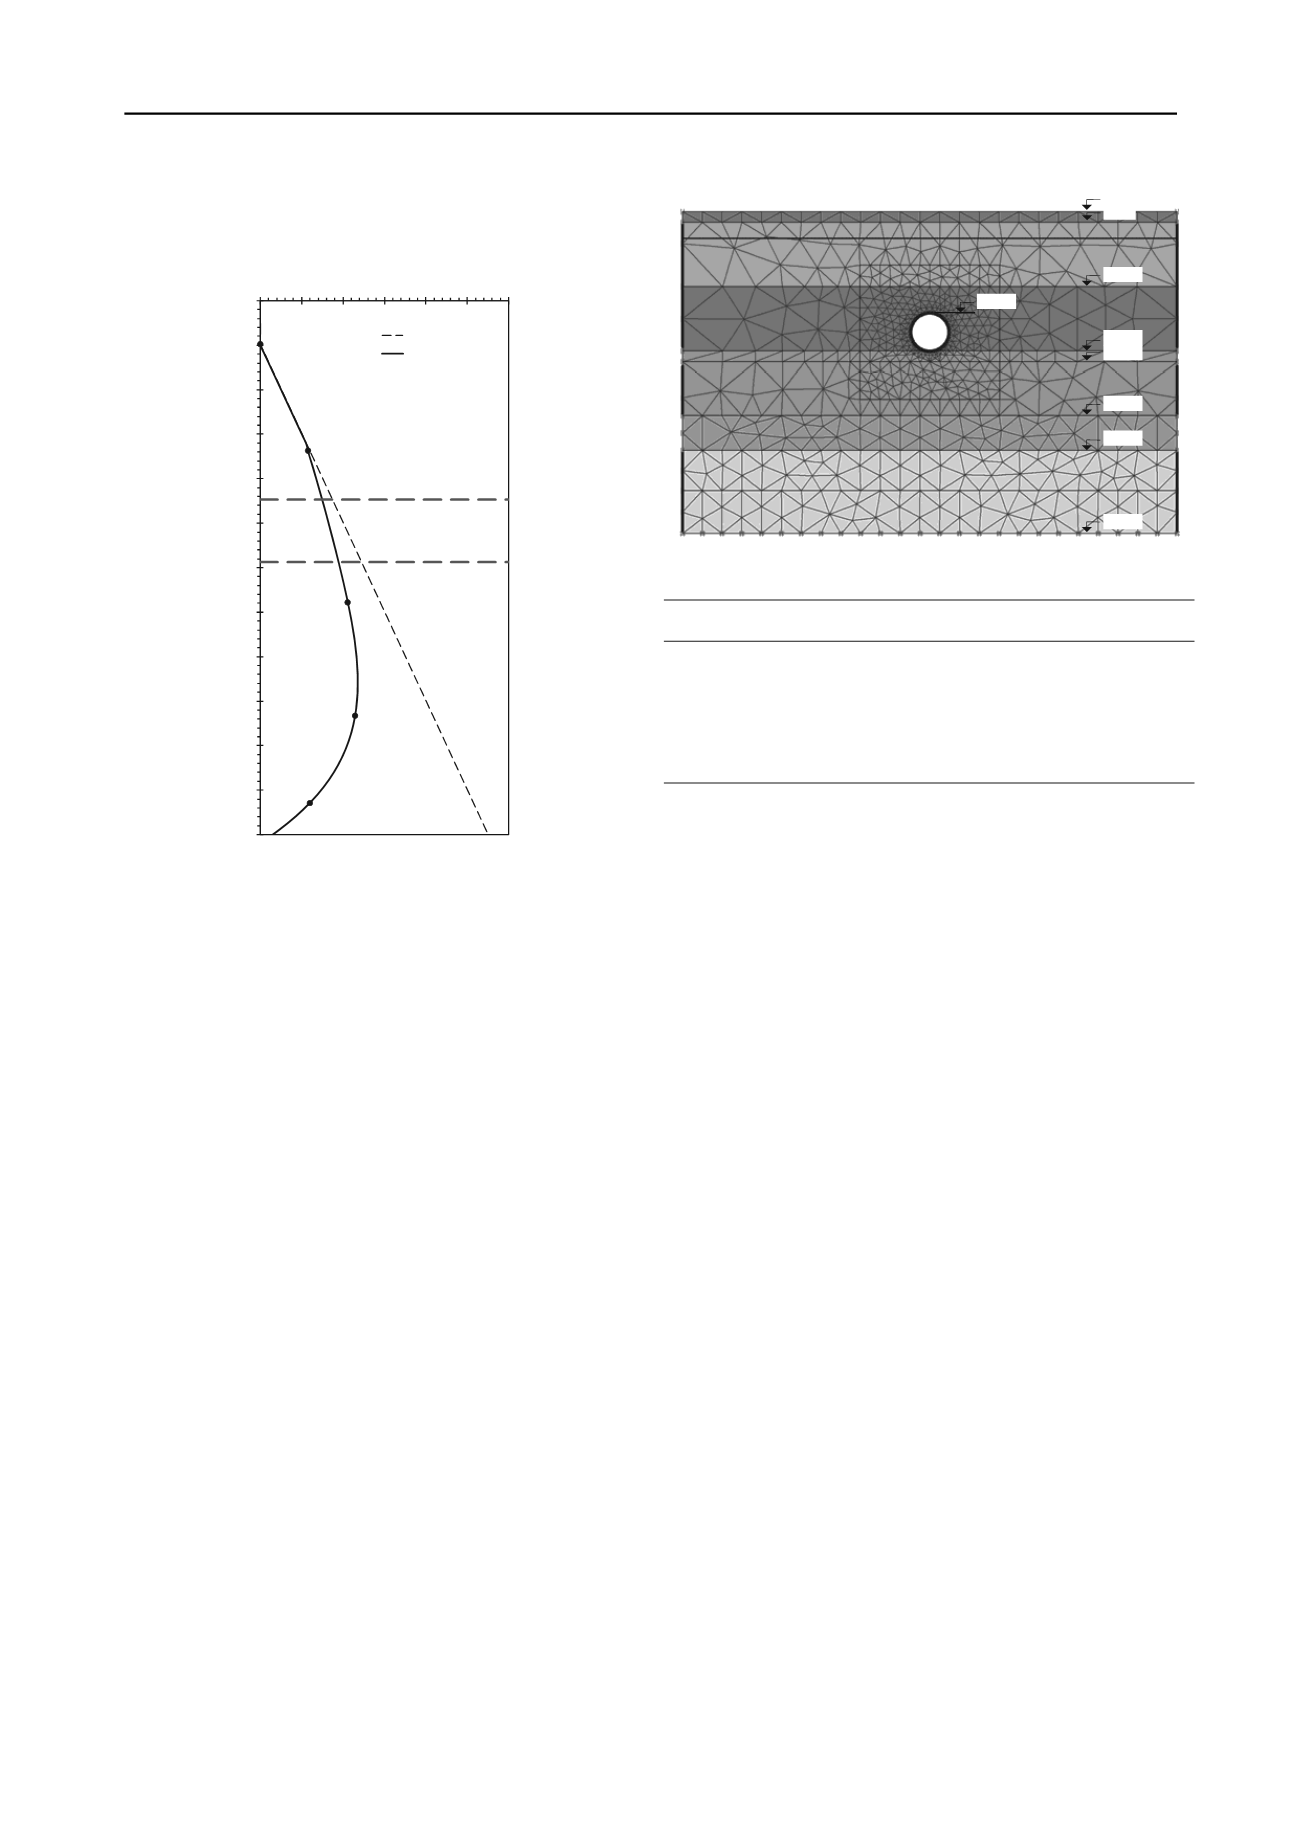
          from a depth of 7m down, reaching up to 400 kPa at a depth of
        
        
          56m. The phreatic level depth (NAF) varies from 3 to 5m.
        
        
          0
        
        
          5
        
        
          10
        
        
          15
        
        
          20
        
        
          25
        
        
          30
        
        
          35
        
        
          40
        
        
          45
        
        
          50
        
        
          55
        
        
          60
        
        
          0 100 200 300 400 500 600


            Profundidad,m


            PresióndePoro, kPa


          Hidrostática
        
        
          Piezométrica


            Por pressure, kPa


          Hydrostatic
        
        
          Piezometric


            Depth, m


            Depth, m


          Figure 1. Pore pressure profile
        
        
          An indirect and approximate way to forecast future pore
        
        
          pressure profile consists of employing a numerical model to
        
        
          evaluate the magnitude of the piezometric drawdown required
        
        
          to induce the regional subsidence that is expected to take place
        
        
          at the end of the design period (50 years) in the area. Such
        
        
          regional subsidence can be estimated from surveys performed
        
        
          on surface references and referred to a deep benchmark. The
        
        
          estimated regional subsidence after 50 years varies from 3.8 to
        
        
          5.8 m.
        
        
          3 NUMERICAL MODELLING


            3.1 Software


          A numerical model was developed using the Plaxis 2D software
        
        
          (


          . Since a long term assessment is required, the
        
        
          analysis was conducted in terms of effective stresses, taking into
        
        
          account drained parameters and non-drained initial conditions
        
        
          (Plaxis bv 2008, Schweiger 2005, Rodríguez-Rebolledo 2011).


            3.2 General characteristics of the model


          Figure 2 shows the finite element mesh and Table 1 presents the
        
        
          soil properties of the different layers used in the numerical
        
        
          model. Mohr-Coulomb and Soft-Soil type models were
        
        
          employed for hard and soft soils, respectively.
        
        
          The modelling is performed in several stages related to the
        
        
          constructive procedure of the tunnel:


              Stage 1. Tunnel excavation and installation of primary


              liner.


          The construction condition right after installation of the
        
        
          primary liner is modelled. In order to take into account the
        
        
          effect of the joints between segments, a reduction factor of
        
        
          stiffness of the ring parameter (


          ), estimated by means of an
        
        
          interactive procedure, is introduced. The procedure consists of
        
        
          varying the magnitude of such parameter so that convergence is
        
        
          obtained between the geotechnical and the structural models. A
        
        
          value of


          = 0.2 was obtained.


            E


            C.S.


            B


            1


            B


            2


            C


            F


            D


          -2.0m
        
        
          0.0m
        
        
          -28.0m
        
        
          -14.0m
        
        
          -60.0m
        
        
          -38.0m
        
        
          -44.5m
        
        
          -26.0m
        
        
          -19.0m
        
        
          Figure 2. Finite element mesh
        
        
          Table 1. Soil properties for the numerical modelling
        
        
          Layer Model


          *


          *


            OCR


          ’


          ur


            K


            o


            =K


            o


            nc


            k


            x


            =k


            y


          m/day
        
        
          CS MC ---
        
        
          ---
        
        
          ---
        
        
          0.30 ---
        
        
          1.00 1x10
        
        
          -2
        
        
          B
        
        
          1
        
        
          SS 0.043 0.260 1.0 ---
        
        
          0.15 0.43 1x10
        
        
          -5
        
        
          B
        
        
          2
        
        
          SS 0.035 0.250 1.0 ---
        
        
          0.15 0.43 1x10
        
        
          -5
        
        
          C MC ---
        
        
          ---
        
        
          ---
        
        
          0.33 ---
        
        
          0.50 1x10
        
        
          -1
        
        
          D SS 0.026 0.227 1.0 ---
        
        
          0.15 0.43 1x10
        
        
          -5
        
        
          E MC ---
        
        
          ---
        
        
          ---
        
        
          0.33 ---
        
        
          0.50 1x10
        
        
          -1
        
        
          F
        
        
          SS 0.023 0.201 1.0 ---
        
        
          0.15 0.43 1x10
        
        
          -4


          * = slope of the swelling line


          * = slope of the normal compression line


            OCR


          = over consolidation ratio


          ’ = Poisson’s ratio


          ur
        
        
          = unload-reload Poisson’s ratio


            K


            0


          = coefficient of earth pressure at rest


            K


            0


            nc


          = lateral earth pressure at rest for
        
        
          normally consolidated states


            k


            x


          =


            k


            y


          = permeability coefficients for


            x


          and


            y


          directions
        
        
          MC = Mohr-Coulomb model
        
        
          SS = Soft-Soil model


              Stage 2. Consolidation of the medium due to the excess of


              pore pressure generated by the excavation of the tunnel and


              installation of the primary liner.


          At this stage it is assumed that
        
        
          the excess of pore pressure generated by the excavation and
        
        
          installation of the primary liner is dissipated before the
        
        
          secondary liner is built (Gutiérrez and Schmitter, 2010) and
        
        
          therefore that it will only affect the primary liner.


              Stage 3. Construction of the secondary liner.


          The
        
        
          construction of the definitive liner is modelled at this stage.
        
        
          Interface elements between primary and secondary liners are
        
        
          used to simulate the discontinuity between both liners.


              Stage 4. Consolidation of the medium due to excess of pore


              pressure generated by construction of the secondary liner and


              piezometric drawdown.


          The behaviour of the tunnel is predicted
        
        
          for the next 50 years. In order to do so, a reduction of the elastic
        
        
          modulus of the concrete due to plastic flow has to be applied
        
        
          (F
        
        
          R
        
        
          , Table 2). The regional subsidence obtained from the
        
        
          numerical model for a total drawdown of the current
        
        
          piezometric conditions was equal to 6.2m. This value is close to
        
        
          the maximum value estimated from field measurements for a
        
        
          period of time equal to 50 years (3.8-5.8m, section 2.2).
        
        
          The primary liner was modelled using volume elements and
        
        
          the secondary liner using plate type elements. Two interfaces
        
        
          were also included: a primary liner-soil interface and, as
        
        
          mentioned, a secondary liner-primary liner interface.


            3.3 Results and discussion


          Figure 3 shows the excess pore pressure around the tunnel
        
        
          originated by construction itself (stage 1). Underneath the
        
        
          tunnel floor, it can be observed that an excess of positive pore
        
        
          pressure is generated due to unloading, whereas close to the
        
        
          lateral sides of the tunnel excess of negative pore pressure
        
        
          develops due to loading. This means that the unloading
        
        
          associated to the removal of the weight of the excavated soil
        
        
          produces an upward general movement of the tunnel, Figure 4
        
        
          (“bubble” effect, Auvinet and Rodríguez-Rebolledo, 2010).