1778
Proceedings of the 18
th
International Conference on Soil Mechanics and Geotechnical Engineering, Paris 2013
A boundary condition at the interface between the pipe and
soil is assumed to be perfectly smooth (
=0). Normal stress
x
=
0
and shear stress
xy
=
K
h
0
are assigned to infinite horizontal
planes. Normal stress
y
=
K
0
0
and shear stress
xy
=
K
h
0
are as-
signed to infinite vertical planes. Here,
0
corresponds to the
vertical stress in the ground produced by soil weight.
K
0
(=
s
/
(1
s
)) is the coefficient of earth pressure at rest, and
K
h
is the
horizontal seismic coefficient.
The maximum and minimum principal stresses (
1
and
3
)
and the angle (
) between the horizontal plane and maximum
principal plane are expressed by
1
=[(1+
K
0
)/2+{(1
K
0
)
2
/4+
K
h
2
}
1/2
]
0
,
3
=[(1+
K
0
)/2
{(1
K
0
)
2
/4+
K
h
2
}
1/2
]
0
, and sin2
=
K
h
/
{(1
K
0
)
2
/4+
K
h
2
}
1/2
. When the two coefficients
K
0
and
K
h
are
given,
K
=
3
/
1
and
can be determined. One of the authors de-
rived the solution of a model in which
1
and
3
act on the infi-
nite horizontal and vertical planes in usual manner of elastic
theory using Airy’s stress function (Tohda and Mikasa 1986).
Thus, the stress and deformation components of the proposed
model can be obtained by transforming this solution into the xy
axes in Figure 1.
2.2
Analytical results
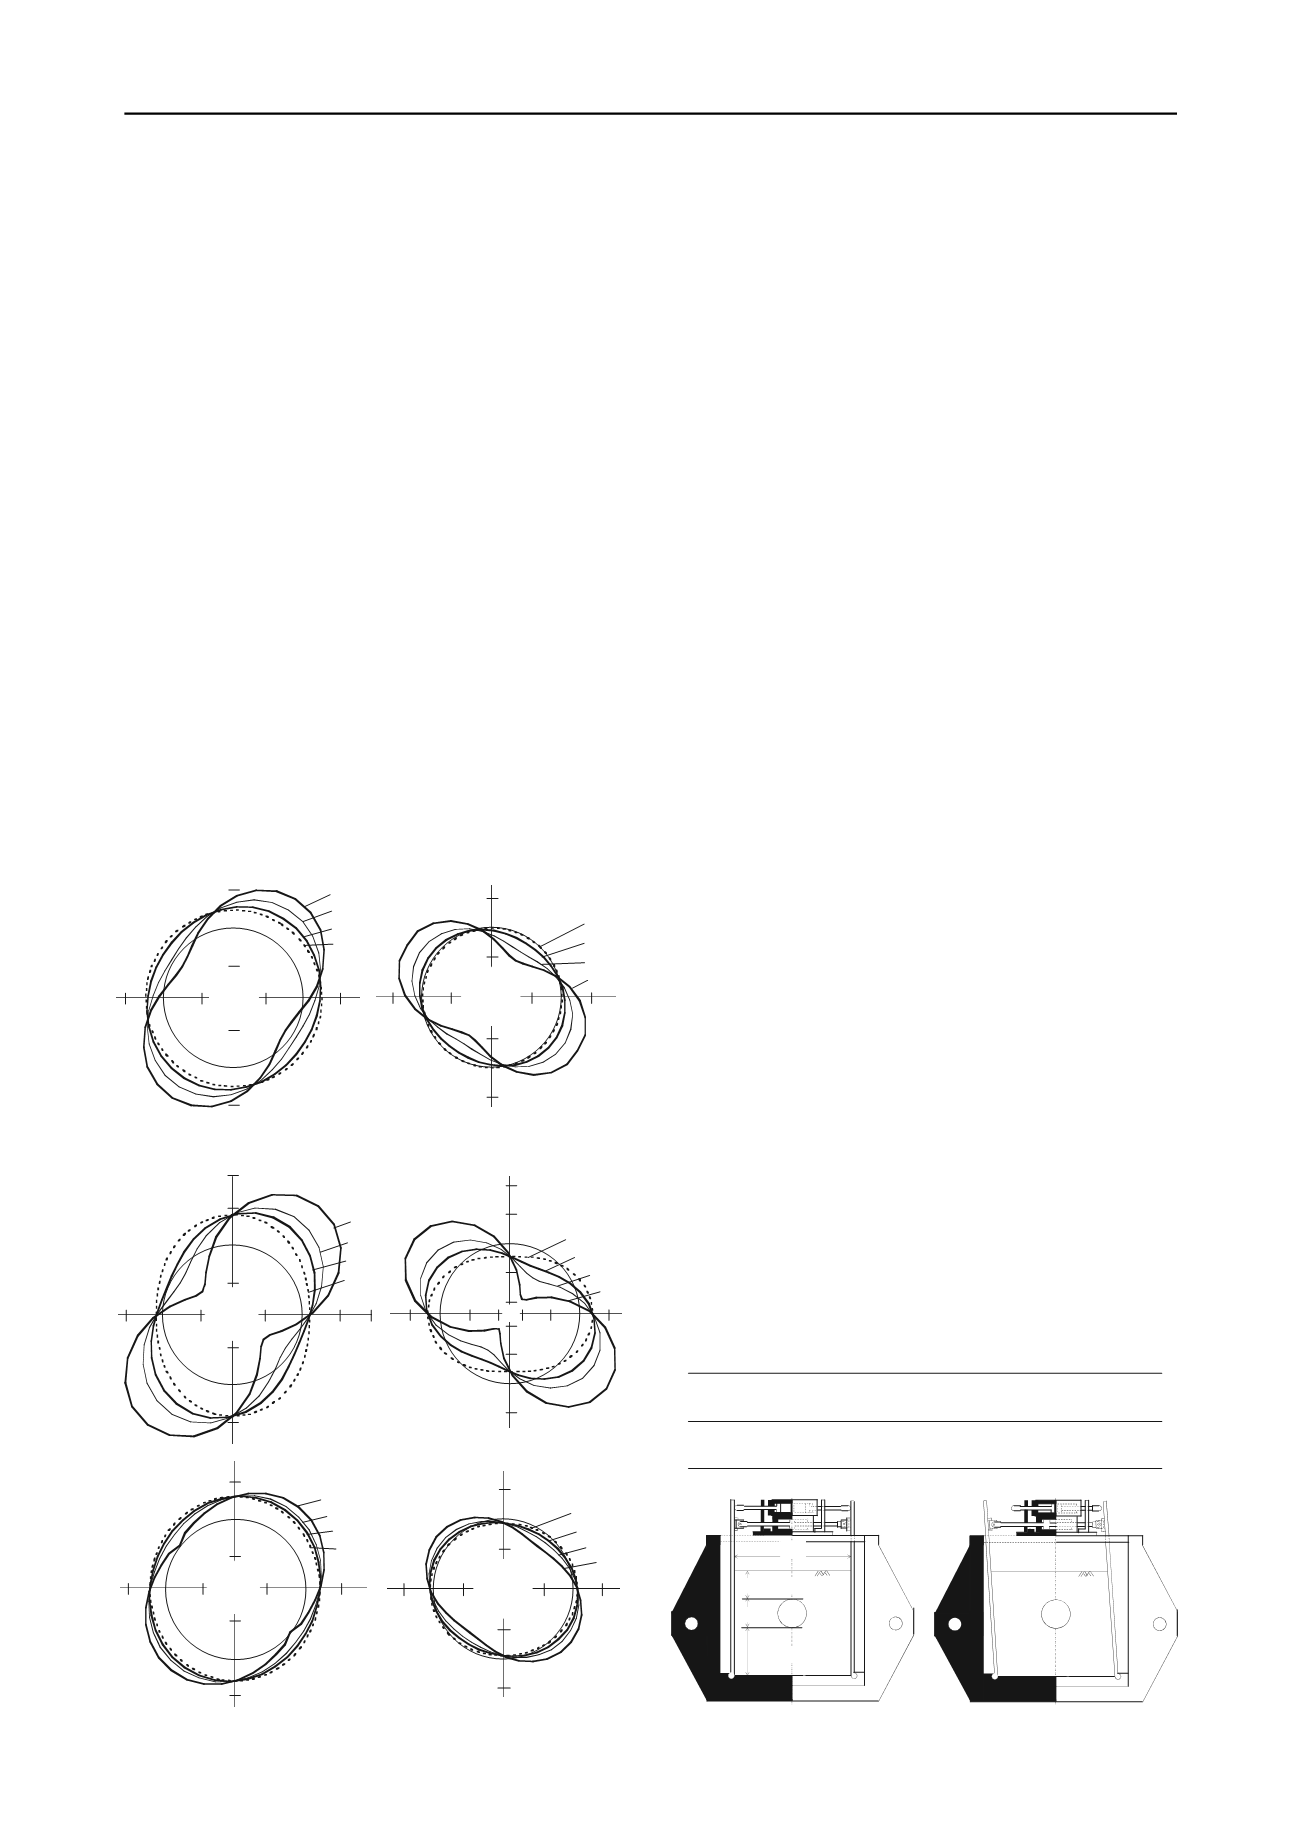
Figure 2, illustrated in polar coordinates, shows the distributions
of normal earth pressure
/
0
acting on the surface of the pipe
and bending moment
M
/(
0
R
2
) produced on the pipe wall, ana-
lyzed for different
when
s
=1/3 (accordingly
K
0
=0.5) and
K
h
=0.5. Compressive
are counted as positive. Positive
M
cor-
responds to the case where the internal surface of the pipe is un-
der tension. Analyzed
acting on the surface of the pipe are null.
Figure 2 indicates that: 1) The symmetric axes of distributions
of both
/
0
and
M
/(
0
R
2
) rotate owing to simple shear of the
model, while the rotation angle is unchanged for any
under
the constant
K
h
condition. 2) The smaller
is, the greater are the
generated maximum values of
/
0
and
M
/(
0
R
2
).
Figure 3 shows
/
0
and
M
/(
0
R
2
) for different
K
h
when
=0.5 and 30,
s
being 1/3 (
K
0
=0.5). As described in Chapter 3,
these two
values are close to those in test cases when R-pipe
and F-pipe were buried in a loose dry silica sand ground (S0L-
ground). Figure 3 indicates that: 1) In both
cases, the greater
K
h
is, the greater are the generated maximum values of both
/
0
and
M
/(
0
R
2
) and the generated value of
. 2) Changes in
/
0
and
M
/(
0
R
2
), as well as their maximum values, are con-
siderably greater when
=0.5 than those of
=30.
3 CENTRIFUGE MODEL TESTS AND EXPERIMENTAL
RESULTS
3.1
Procedure of centrifuge model tests
Two model aluminum pipes, whose dimensions and material
properties are shown in Table 1, were used in the tests. They
were named as R-pipe and F-pipe according to their flexibilities.
Their external diameters (
D
) and lengths were 90 mm and 148
mm, respectively. Their wall thickness (
t
) varied from 3.5 mm
to 0.95 mm, so that their
S
p
values are similar to those of the
RC-pipe and plastic-pipe (either FRPM-pipe or PVC-pipe) pro-
totypes. The surfaces of the pipes were smoothly finished to
simulate those of the prototype pipes. Normal (
) and tangen-
tial (
) earth pressures acting on the pipe surface at 20 measur-
ing points, as well as bending strains (
) produced on the walls
of the pipes at 16 measuring points, were measured
.
The struc-
ture of the model pipes and their instruments were detailed in
the literature (Tohda et al. 2010b).
Figure 4 shows the model configuration. The model was
scaled to 1/30 of the prototype. The model pipes were buried in
model grounds with a cover height (
H
) of 9 cm or 18 cm (
H
/
D
=
1 and 2) and a distance from the pipe bottom to the ground bot-
tom (
H
b
) of 15 cm. Thick aluminum plates with hinge systems
at the lower ends were placed at the lateral sides of the model
grounds. The internal front and back walls of the container, as
well as the internal surfaces of the lateral-side plates, were lu-
bricated by means of two sheets of rubber membrane with sili-
con grease. A sheet of water resistant sand paper (grain size
=0.3
0.7 mm) was pasted on the bottom of the container.
Two types of soils, dry silica sand (S0) or decomposed gran-
ite (S16), were used in the tests. Loose and dense S0-grounds
(S0L- and S0D-grounds) were constructed by dry pluviation,
and loose S16-ground (S16L-ground) was constructed by com-
paction. The pluviation or the compaction was carried out in the
Figure 4. Model configuration (unit: mm).
363
H
=
90, 180
D
=
90
H
b
=
150
(a) Before shear deformation
(b) During shear deformation
H
=90, 180
D
=90
b
=150
Figure 3. Analyzed
/
0
and
M
/(
0
R
2
) for different
K
h
(
K
0
=0.5,
s
=1/3).
(a)
=0.5 (R-pipe).
(b)
=30 (F-pipe).
2
-2
-2
-2
-2
2
2
2
/
0
K
h
0
0
0
0
0
1
0.5
0.25
-1
1
1
-0.5
-0.5
M/
(
0
R
2
)
1
0
0
0
0
0
0.25
0.5
K
h
-0.5
2
-2
-2
-2
-2
2
2
/
0
0.25
0
2
0
0
0
0
K
h
1
0.5
-0.5
-0.5
-0.5
-0.5
M/
(
0
R
2
)
1
0
0
0
0
0
0.25
0.5
K
h
0.5
0.5
0.5
0.5
-0.5
0.5
-0.5
-0.5
M/
(
0
R
2
)
0
0
0
0
0.5
Figure 2. Analysed
/
0
and
M
/(
0
R
2
) for different
(
K
h
=0.5,
K
0
=0.5,
s
=1/3).
2
-2
-2
-2
-2
2
2
2
/
0
0
0
0
0
Figure 2. Analyzed
/
0
and
M
/(
0
R
2
) for different
(
K
h
=0.5,
K
0
=0.5,
s
=1/3).
Table 1. Dimensions and material properties of model pipes.
D
t
E
p
S
p
R-pipe
F-pipe
90
90
3.5
0.95
74
74
0.33
0.33
3.60
0.066
(mm)
(mm)
(GPa)
(MPa)
p
Model
pipe


