1783
Technical Committee 204 /
Comité technique 204
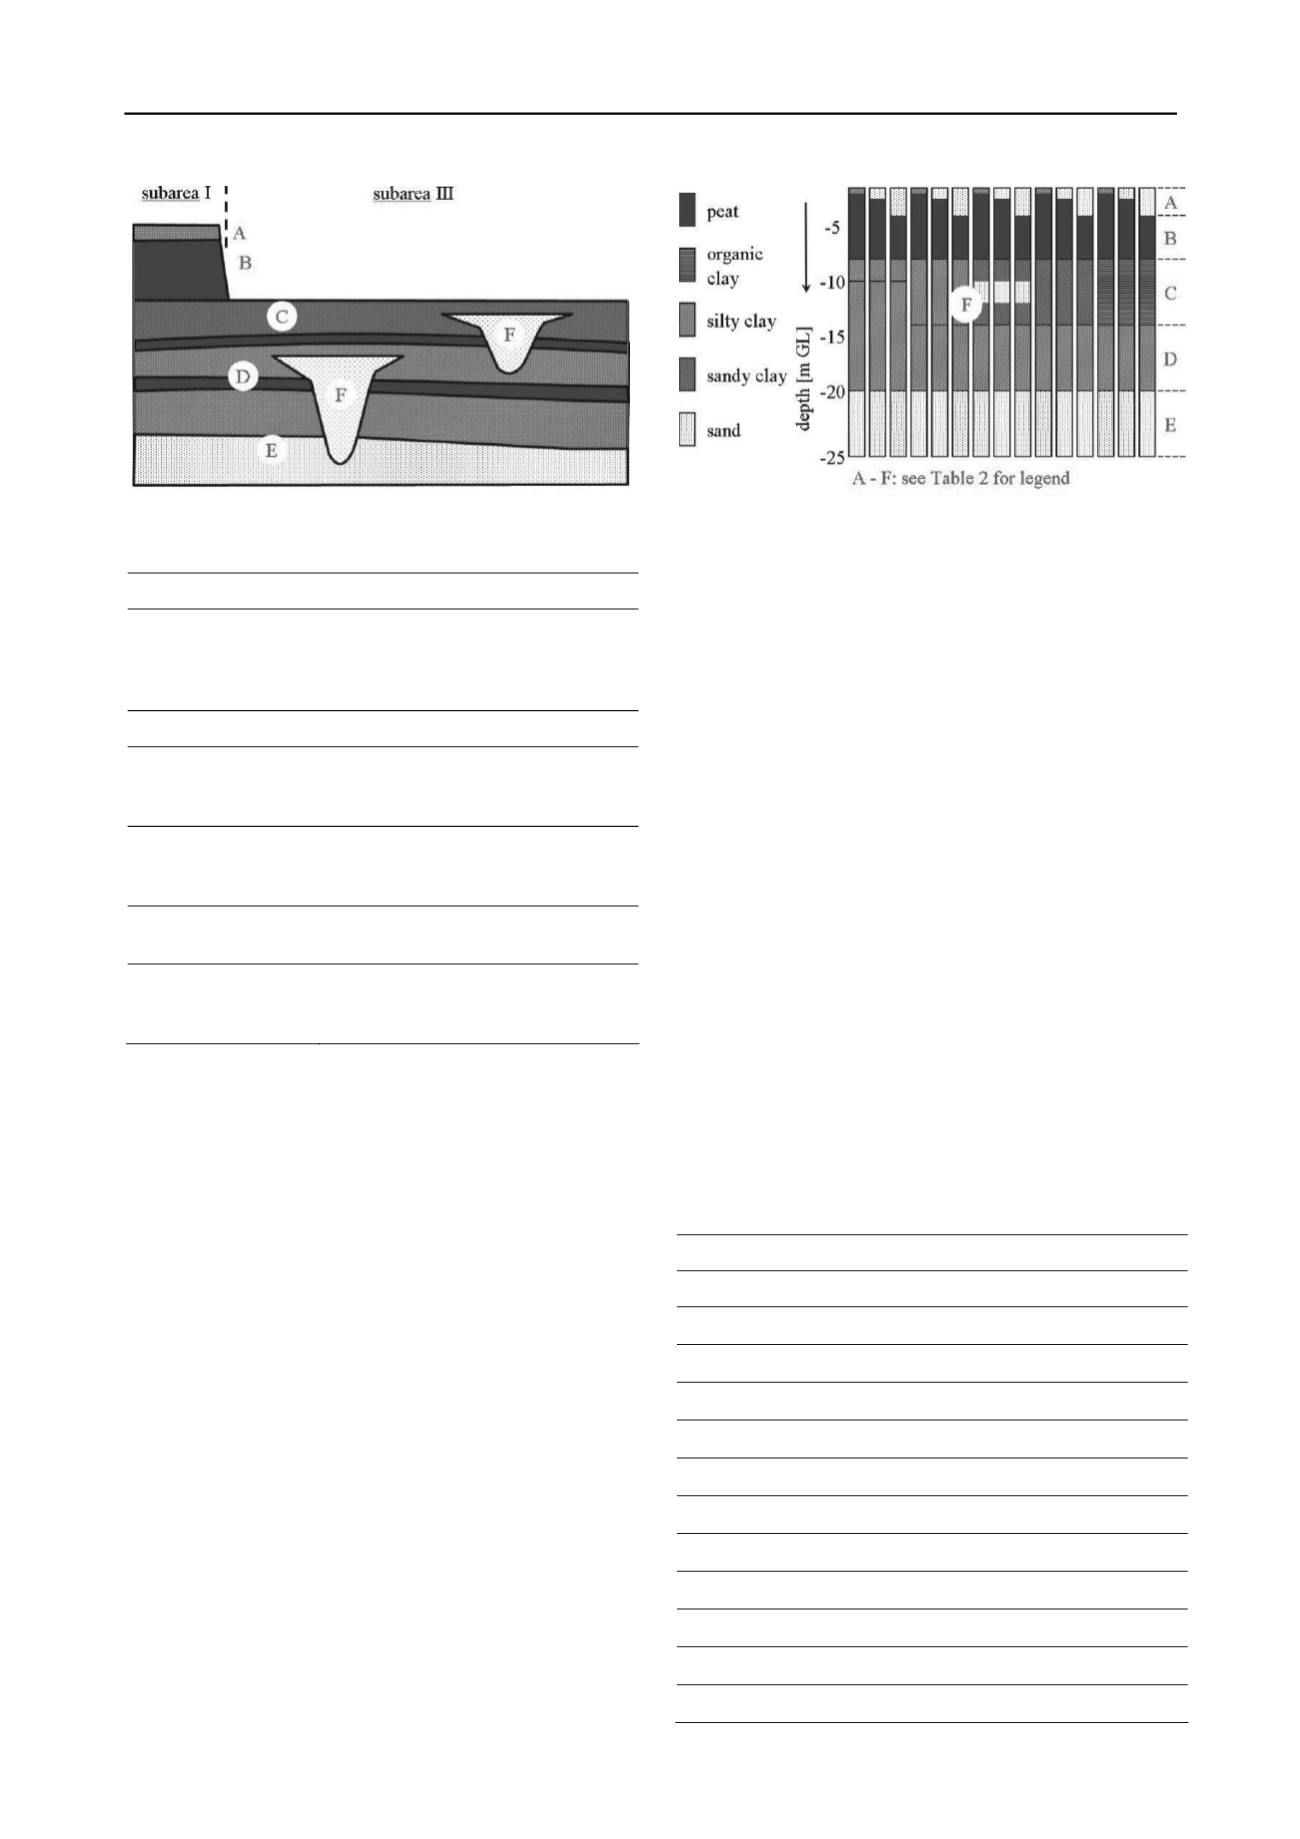
Figure 2. Simplified geological section showing subsoil phenomena
relevant to failure.
Table 2. Subsoil hazard associated with phenomena in Figure 2.
Unit / phenomenon
Subsoil hazard
A. Clay cover / man-
made deposits
Differential settlements due to old
surcharges and buried sand filled
channels
Large (post-construction) settlements
B. Peat
Large (post-construction) settlements
C. Mudflat deposits:
sand, silt, clay with
intermediate peat layers
Differential settlements due to buried
sand filled channels
Large (post-construction) settlements
D. River deposits: sand,
silt, clay with
intermediate peat layers
Differential settlements due to buried
sand filled channels
Large (post-construction) settlements
E. Pleistocene river
deposits: sand
Artesian pressure
Varying bearing capacity
F. Buried sand filled
channels
Differential settlements
Contact with Pleistocene deposits;
artesian pressure
Modelling of the lithological variation is based on 76 borings,
96 CPTs and layer boundaries of the GeoTOP 3D geological
model, all obtained from the Dutch national DINO database.
The information density of 10 verticals per km
2
is considered
sufficient for compilation of a representative subsoil model, but
will not allow detailed mapping of heterogeneity.
The project area is divided in 4 subareas (Figure 1), each
with a different set of discrete subsoil profiles. Each profile is a
synthetic stack of scenarios for the layers Pleistocene deposits,
river deposits, mud flat deposits, peat and man-made deposits.
The total number of combinations can be huge, because up to 4
scenarios can be identified for every layer. Two hundred
profiles remain for the entire project area after elimination of
improbable or identical subsoil profiles. These profiles represent
the subsoil variation in the area, made accessible for design
calculations with conventional tools. Weighted averages and
standard deviations can be determined, by estimation of the
frequency of occurrence of the profiles.
Figure 3 gives an example of part of the discrete subsoil
profiles synthesized for subarea I. The main difference between
the areas is the peat layer that is thicker in subarea I than in
subareas IIa and IIb, and has been excavated in subarea III. In
subarea IIb the layer is more clayey than in subarea IIa.
Conservative estimates of the geotechnical parameters are
derived from correlations with lithology and inferred volume
weights. Variation coefficients of compression parameters are
estimated at 23%; the consolidation coefficients are assumed to
vary by a factor 2.
Actual CPTs are entered directly in the foundation design of
the piled embankments, rather than synthetic subsoil profiles.
Figure 3. Part of the synthetic soil profiles for subarea I.
The analyses for the traditional method are performed in batch
using the software MRoad (Venmans et al., 2005), that
combines analytical settlement calculations using an isotache
model with automatic determination of whole life cost. The
standard deviation of the whole life costs is derived by
summation of the variance caused by subsoil heterogeneity and
the variance caused by permutations of the other design
parameters around their average values. The variance caused by
subsoil heterogeneity is reduced for length effects along the
road alignment. Subsoil profiles for the soft layers are assumed
to differ every 50 m. Foundation characteristics of the
Pleistocene sand layer are found to vary over distances less than
20 m in the design of the piled embankment.
Settlements in the traditional method are in the order of
2.20 m in areas I and IIa, with standard deviations of 1 m. In
areas IIb and III the top peat layer is much thinner or missing,
and settlements are smaller, 1.40 m and 1.00 m respectively.
Standard deviations are around 0.30 m.
Post-construction settlements are highly variable in all
subareas, with values up to 0.40 m in 30 years for the traditional
method with 1 year surcharge time. However, the average
values satisfy the design specification of 0.15 m. Uncertainty in
compression parameters and consolidation coefficients is the
main source of the uncertainty in the post-construction
settlements. The post-construction settlements for a surcharge
time of 2 years are smaller than the 0.15 m in all locations.
Table 3 summarizes the results of the cost calculations. The
design of the piled embankment is the same for all areas,
because no systematic trends can be observed in the foundation
characteristics of the Pleistocene sand layer.
Table 3. Whole life costs of 500 m road for different areas.
Cost parameter
I
IIa
IIb
III
Traditional method, 1 year surcharge time
Average
676 k€
659 k€
612 k€
562 k€
90% upper limit
815 k€
816 k€
796 k€
697 k€
Uncertainty
21% 24% 30% 24%
Traditional method, 2 year surcharge time
Average
687 k€
668 k€
588 k€
550 k€
90% upper limit
762 k€
752 k€
646 k€
598 k€
Uncertainty
11% 13% 10% 9%
Basal reinforced piled embankment
Average
1601 k€
1601 k€
1601 k€
1601 k€
90% upper limit
1692 k€
1692 k€
1692 k€
1692 k€
Uncertainty
6% 6% 6% 6%


