1779
Technical Committee 204 /
Comité technique 204
direction parallel to the longitudinal axes of the model pipes.
The properties of the model grounds are shown in Table 2.
At a centrifugal acceleration field of 30
g
(
g
: gravitational
acceleration), the lateral-side plates were rotated by means of
the hydraulic cylinder in parallel cyclically ten times, first to the
left-side and next to the right-side, until simple shear strain (
)
of the model ground reached 3.2 %. Time required for one cycle
was 6 minutes. The value of
=3.2 % was determined as an av-
erage value of relative shear strains produced between the bot-
tom and top of the pipes that were buried in the different model
grounds under resonant conditions due to level-2 seismic mo-
tions.
3.2
Experimental results
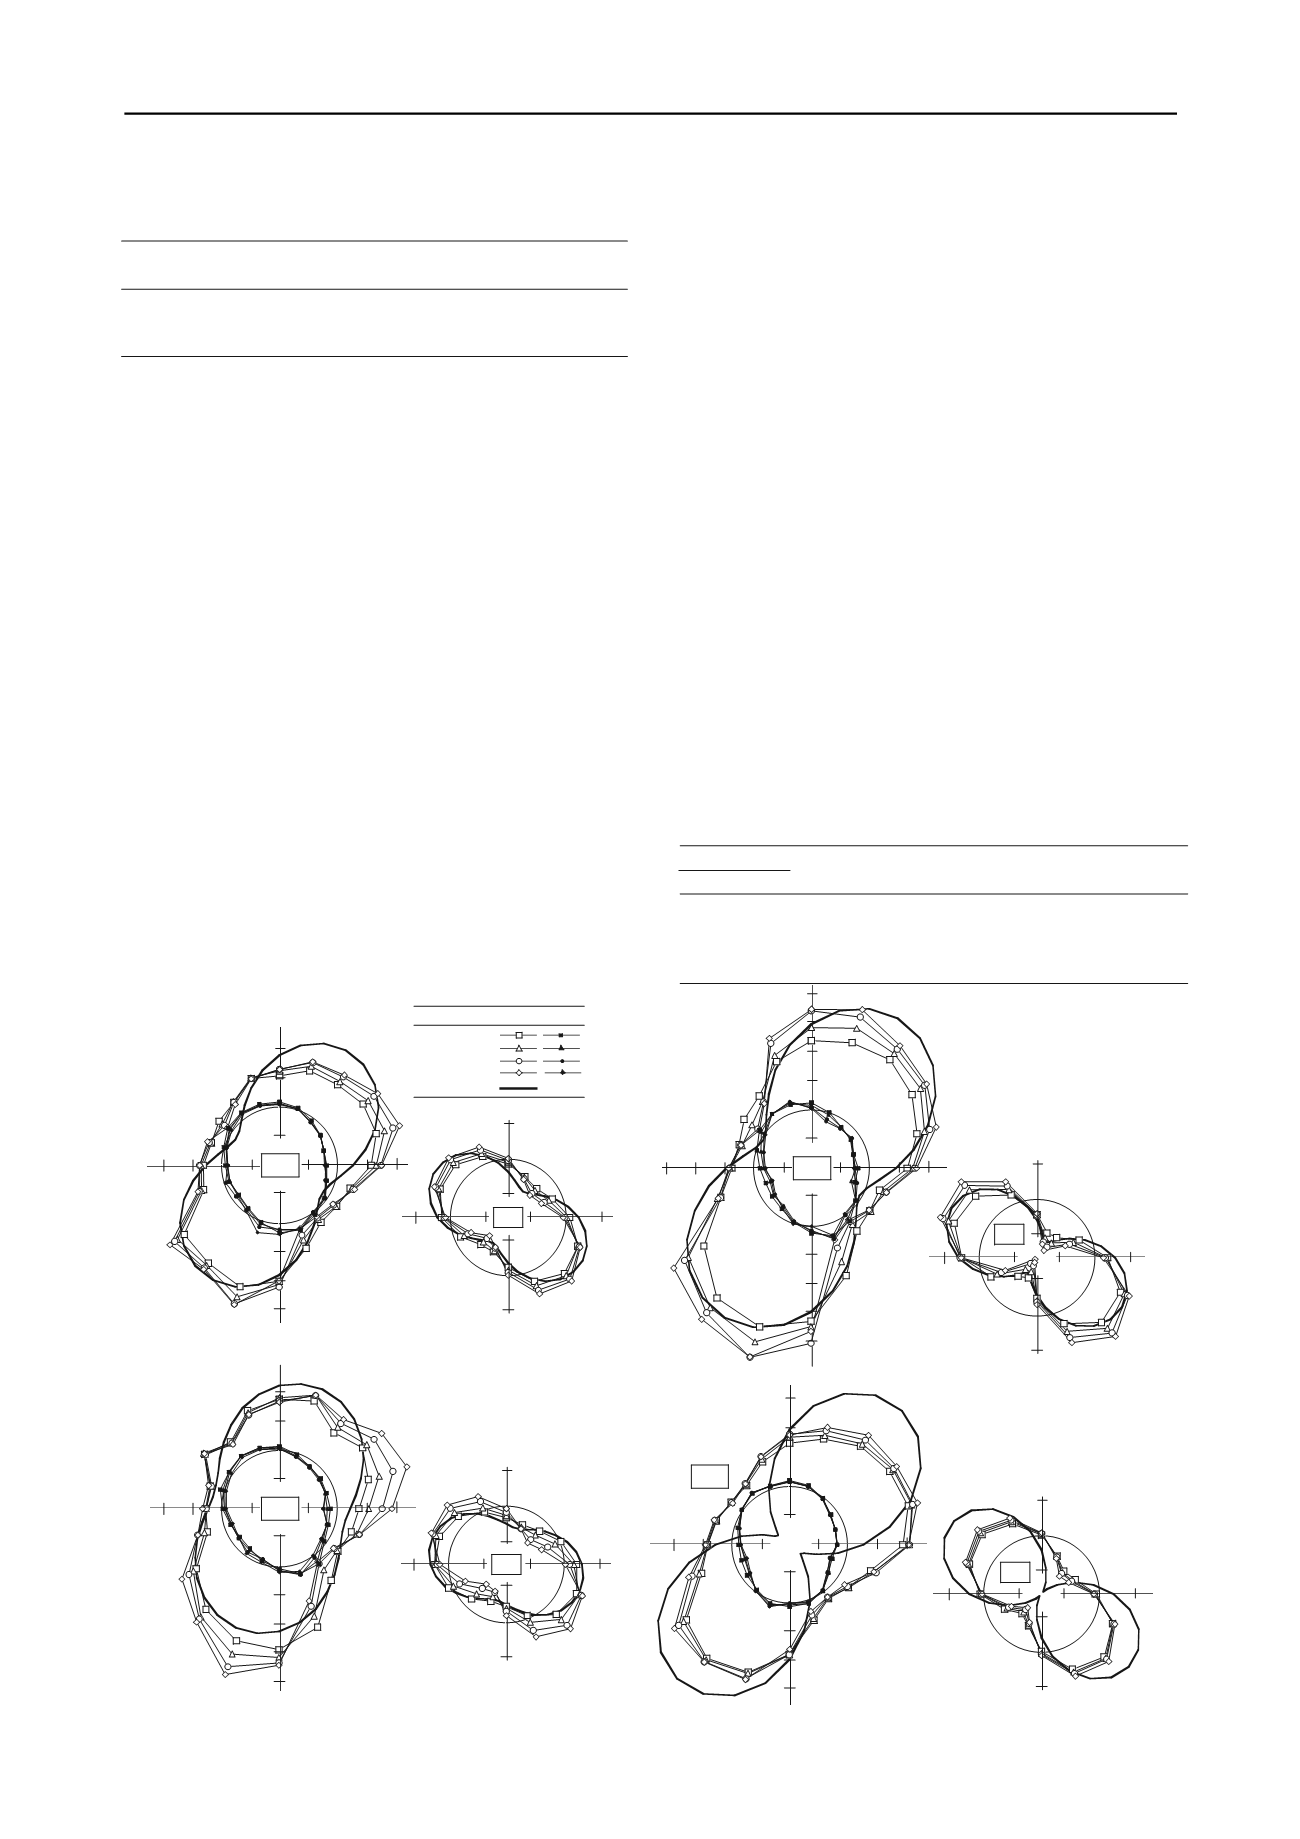
Marks and thin lines in Figure 5 (R-pipe) and Figure 6 (F-pipe)
show
,
, and
M
that were measured at
=3.2 % when the
ground was deformed to the left-hand side. The marks and thin
lines correspond to the data measured at
N
=1, 2, 5, and 10 (
N
:
number of repetition times for shear). Measured
acting coun-
terclockwise are counted as positive.
Measured results shown in Figures 5 and 6 indicate that: 1)
and
M
increase with an increase in
N
owing to hardening of
soils due to repetitive shear deformation, but they have tenden-
cies to converge when
N
5. 2)
are always close to be null. 3)
When
H
/
D
=1, the model grounds with greater
K
h
tend to gener-
ate greater maximum values of
and
M
, as well as greater
. 4)
Changes in
and
M
due to the differences in the test conditions,
as well as the maximum values of
and
M
, are considerably
greater in R-pipe than in F-pipe.
,
and
measured for the two model pipes in the present
tests were compared with those measured in other dynamic cen-
trifuge model tests (Tohda et al. 2010b), in which the same mo-
dels as those in the present tests were oscillated 10 times by 1
Hz sinusoidal horizontal acceleration wave with an amplitude of
0.8
g
. The comparison showed that: 1) The mechanical behavi-
or of the model pipes obtained in both centrifuge model tests
was similar qualitatively. 2) The maximum bending strains
(
max
) when
H
/
D
=1 yielded similar magnitudes in both tests, but
max
when
H
/
D
=2 were 2 to 3 times greater in the present tests
than in the dynamic tests (Ohsugi et al. 2011).
4 COMPARISON BETWEEN ANALYTICAL AND EX-
PERIMENTAL RESULTS
Input parameters used in the analysis for each experiment were
determined as shown in Table 3, as it follows: 1) Total vertical
stress in the model ground at the mid-height of the model pipe
was assigned to the boundary stress
x
=
0
. 2) Values of both
E
s
at
0
and
s
(constant regardless of
0
) were determined from
K
0
-compression tests using a rectangular box. 3)
K
0
value was
obtained from
s
through
K
0
=
s
/(1
-
s
). 4)
xy
and
K
h
values
were obtained from
E
s
,
s
and
=3.2 % through
xy
=
G
=
E
s
/{2(1+
s
)}=
K
h
0
. Table 3 indicates that the difference in
K
h
Table 2. Properties of model grounds.
S0L
S0D
S16L
D
max
(mm)
F
c
2.65
2.65
2.71
1.4
1.4
2.0
0
0
16
1.75
1.75
70
1.58
1.58
1.92
1.32
1.32
1.42
1.43
1.55
1.50
0
0
10
dmax
(g/cm
3
)
dmin
(g/cm
3
)
d
(g/cm
3
)
w
(%)
U
c
G
s
Ground
Table 3. Input parameters used in the analysis for each experiment.
S0L
S0L
S16L
S0D
0
(kPa)
s
E
s
(kPa)
xy
(kPa)
H
/
D
Ground
1
2
1
1
Test condition
K
0
K
h
57
95
66
62
0.37
0.37
0.33
0.35
2050
2880
830
4570
0.59
0.59
0.49
0.54
24
34
10
54
0.42
0.35
0.15
0.88
-50
0
0
0
0
-50
-50
-50
(kN
·
m/m)
M
50
0.1
0
0
0
0
0.1
0.1
0.1
(MPa)
-50
0
0
0
0
-50
-50
-50
(kN
·
m/m)
M
50
50
0.1
0
0
0
0
0.1
0.1
0.1
(MPa)
0.2
-50
0
0
0
0
-50
-50
-50
(kN
·
m/m)
M
50
0.1
0
0
0
0
0.1
0.1
0.1
(MPa)
0.2
0.2
-50
0
0
0
0
-50
-50
-50
M
(kN
·
m/m)
50
50
0.1
0
0
0
0
0.1
0.1
0.1
(MPa)
1
2
5
10
Analysed
Measured
N
,
Figure 5. Comparison between measured and
analytical
results (R-pipe).
(a) S0L-ground,
H
/
D
=1.
(b) S0L-ground,
H
/
D
=2.
(c) S16L-ground,
H
/
D
=1.
(d) S0D-ground,
H
/
D
=1.
Figure 5. Comparison between measured and analytical results (R-pipe).
1
2
5
10
Analyzed
Measured
N
,
Figure 5. Comparison between xperimental
ti l results (R-pipe).


