1697
Technical Committee 204 /
Comité technique 204
3 NUMERICAL MODEL
In order to investigate the stress reduction mechanism of
geogrid bridging, finite element analyses (FEA) were carried
out using the software package Plaxis 2D (Plaxis bv. 2011).
Two sets of numerical models were developed to analyze
stresses generated in cases of PPM installation (Section 1) and
the 3 m wide at-grade geogrid bridging, GB (Section 4)
installation. An elastic-plastic soil model with Mohr-Coulomb
failure criterion is used during the simulation of full scale field
test due to the simplicity of the model and availability of model
parameters.
The strength parameters were determined and reported in a
geotechnical investigation and design report prior to the
construction of test embankment. However, no direct
determination for the stiffness properties of soil was performed.
Thus, elastic moduli for various soils were determined based on
experience and calibrated against the deformation of
embankment. The stresses within the trench were affected by
the stiffness of the granular fill. Thus, the hyperbolic hardening
soil model from the Plaxis’ library was used to model the stress
dependent variation of stiffness of the fill materials within the
trench. A fully fixed boundary condition was applied at the base
of the models. The lateral boundaries of the models were placed
such that a distance equal to five times of embankment width
was maintained between the toe of the embankment and the
external boundaries of the soil domain, which is assumed to be
free in vertical direction and fixed in horizontal direction. The
subsurface conditions were determined using three boreholes
drilled within the footprint of embankment. The soil
stratigraphy comprises clayey-silt-till/silty-clay-till from ground
surface to a depth of 10 m (Layer 1). The Layer 1 is underlain
by a layer of silt/silty-clay layer to a depth of 20 m (Layer 2).
The embankment was constructed using native clayey silt-
till/silty-clay-till material. Table 1 summarizes the mechanical
properties of foundation soils, embankment fill and the
materials that comprise the trench fill.
4 RESULTS AND DISCUSSION
The results of the field test are presented here along with the
results of the FE analyses performed to investigate the trends of
stress variations measured during the field tests using the
estimated soil properties. The accuracy of the numerical
analyses is subjected to realistic material property assumptions.
The comparisons of the measured and calculated stresses for
PPM and GB installations show that despite local differences in
the magnitudes of stresses, the similar trends of stresses are
captured using the material properties outlined in Table 1. The
complex geometry of embankment-trench system and the use of
material with different stiffness values around the load cells
make the stress regime within the trench very complex both in
field test and numerical analyses. Thus, the main objective was
to show the influence of the geogrid bridging on the stresses
occurring in a trench, rather than presenting an exact stress
values that may occur in a conduit installation.
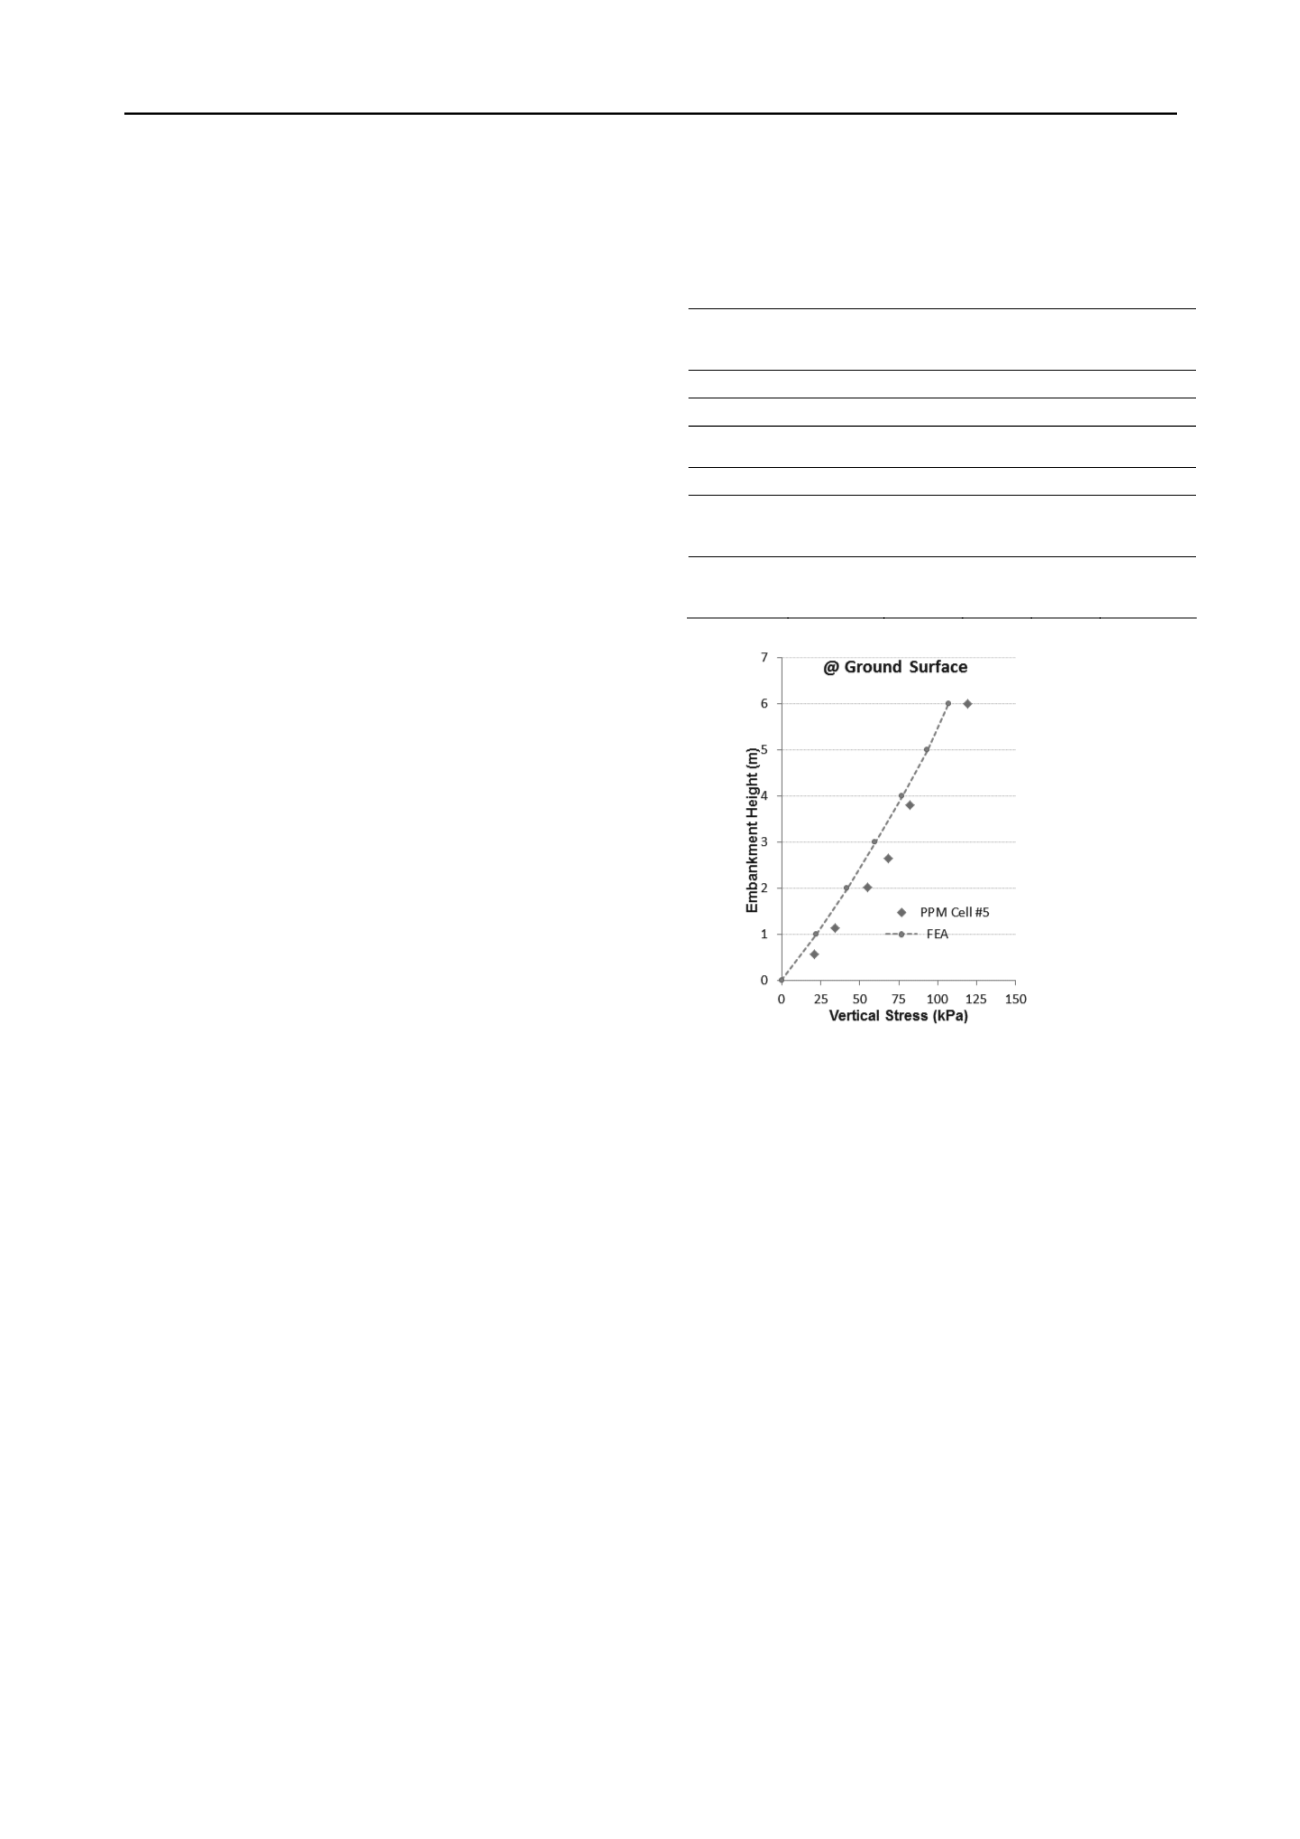
Figure 3 shows the variation of vertical stresses measured at the
foundation-embankment interface (cell 5) with the embankment
height. As it can be seen from Figure 3, the vertical stresses
show a typical increase that is almost linearly proportional to
depth of embankment.
4.1
Stresses Measured at Mid-height of the Trench (1.5 m)
Figure 4 shows the variation of the vertical and horizontal
stresses that were measured at 1.5 m depth in the trench (cells
1and 2, vertical and horizontal pressure cells for PPM; and cells
17 and 18, vertical and horizontal pressure cells for GB) and its
comparison to the stresses predicted by the FE analyses.
Table1. The parameters used in the FEA.
* unit weight varies with depth
+ in HSM m=0.5 and E
ur
= 3E
50
Figure 3. Compression of the FEA results with the vertical stress data
obtained from the field test at the foundation-embankment interface.
The results indicate that there is a reasonable agreement
between measured and calculated vertical and horizontal
stresses. The results shown in Figure 4a indicate that the vertical
stresses increased as the embankment height was increased.
This increase ranges from 45 kPa to 76 kPa for PPM installation
and from 45 kPa to 60 kPa for GB installation for embankment
heights of 1m and 6 m, respectively. The results indicate that
22% reduction in vertical stresses was achieved by the use of
GB installation when the full embankment height is reached.
The horizontal stress showed an inverse trend. The results
shown in Figure 4b indicate that the increased embankment
height increased the horizontal stresses from 11 kPa to 29 kPa
for PPM installation and from 18 kPa to 33 kPa for GB
installation. The results indicate that the use of GB installation
increased the horizontal stresses relative to those generated by
PPM installation. This increase was as high as 60% at the start
of embankment construction. However, the difference
weakened as the embankment height increased.
The results also show that both vertical and horizontal stresses
measured/calculated at the 1.5 m depth are substantially lower
than the values one would practically approximate using the
depth of overburden and the unit weigh of material. Such
reduction is caused by lightly compacted uniform granular
surrounding, which has a substantially lower stiffness that
reduced the magnitude of both vertical and horizontal stresses.
Constitutive
Modeling
Unit
Weight
(kN/m
3
)
Modulus
of
Elasticity
E
oed
(MPa)
Angle of
internal
friction
Layer 1
MC
22
130
-
40
Layer 2
MC
22
160
-
42
Embankmen
t Fill
MC
20-22*
95
-
33
Trench Fill
HSM
+
20
130 130
36
Lightly
compacted
surrounding
HSM
+
18
20
20
33
Well
compacted
surrounding
HSM
+
22
120 120
35


