1692
Proceedings of the 18
th
International Conference on Soil Mechanics and Geotechnical Engineering, Paris 2013
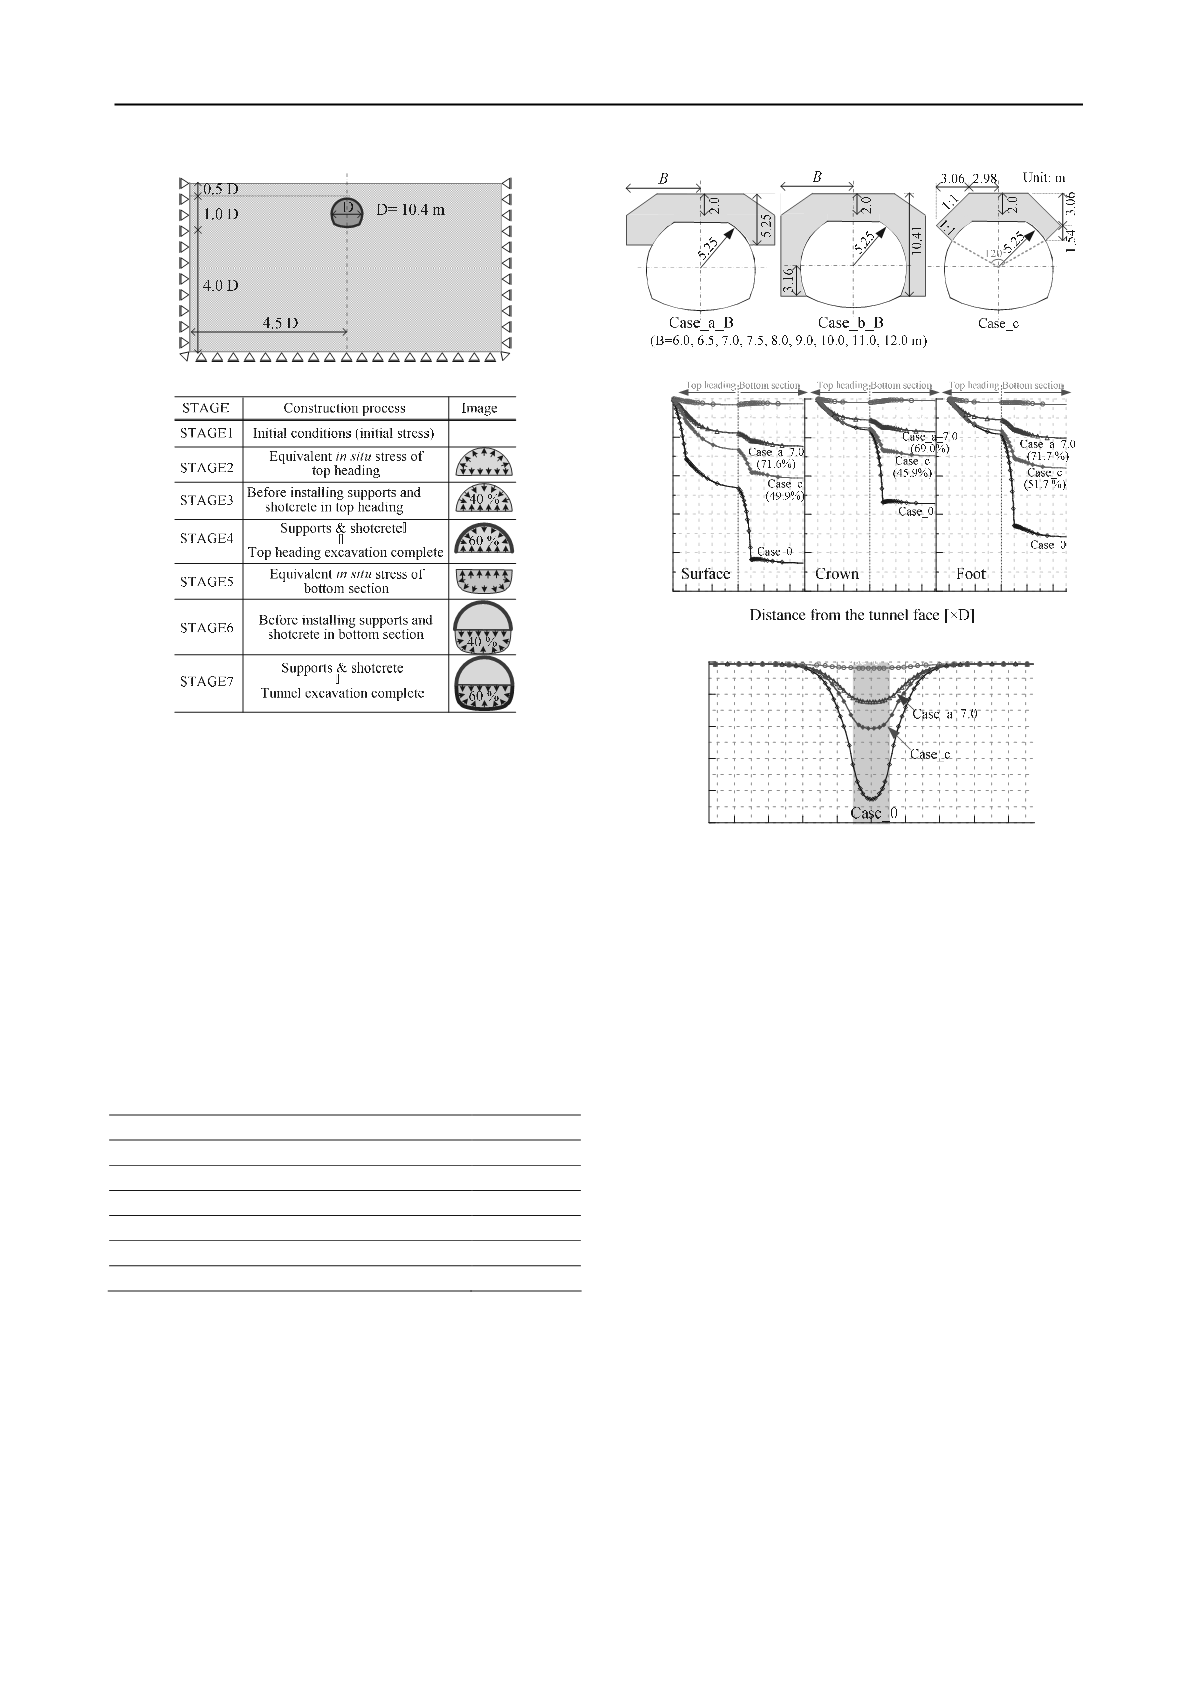
Figure 2. Analysis area and boundary conditions
Figure 3. Analysis procedure
2 OUTLINE OF NUMERICAL ANALYSIS
2.1
Modeling of ground, lining and tunnel excavation process
Figure 2 shows the analysis area and the boundary conditions.
The object of the analysis was determined based on the
construction field data. The overburdens were varied between
2.0 m and 5.25 m (0.5 D).
The subloading
t
ij
model (Nakai & Hinokio, 2004) was used
to simulate the ground material. The properties of the model
ground are given in Table 1. Density
and void ratio
e
were
measured by
in situ
tests, while the other parameters were
referred to certain references (Iizuka & Ohta, 1987; Nakai &
Hinokio, 2004).
Table 1. Properties of natural ground
Density
(×10
3
kg/m
3
)
1.50
Poisson
’
s ratio
0.36
Void ratio (
e
0
)
1.27
Coefficient of earth pressure at rest
k
0
0.56
Principal stress ratio at critical state
2.60
Compression index
0.1154
Swelling index
0.02
The improved ground was modeled as an elastic material.
Young’s modulus was calc
ulated based on compressive strength
q
u
(
N
=8
q
u
/100,
E
=2800
N
). The values used in this analysis
were 2.24×10
5
kN/m
2
(
q
u
=1.0×10
3
kN/m
2
).
The tunnel lining was modeled as a composite elastic beam
unifying the tunnel supports and the shotcrete. Flexural rigidity
EI and axial rigidity EA of the composite beam were made to be
equal to the sum of the corresponding values of the supports and
the shotcrete. The Young’s modulus of the
composite beam was
taken as 1.23×10
7
kN/m
2
(Cui et al., 2010).
The tunnel excavating process was simulated by the release
of an equivalent force to excavation. The analysis included
seven steps, as shown in Figure 3.
Figure 4. Analytical patterns for different improved areas
-500
-400
-300
-200
-100
0
0 2 4 6 8
Settlements [mm]
0 2 4 6 8 0 2 4 6 8
Figure 5. Temporal changes in settlements of ground and tunnel
-500
-400
-300
-200
-100
0
-40 -30 -20 -10 0 10 20 30 40
Distance from center of tunnel [m]
Surface settlements [kN/m
2
]
Figure 6. Surface settlement when tunnel excavation completed
2.2
Analysis patterns
Figure 4 shows the analytical patterns for different widths of the
improved areas. The ground was improved around the crown of
the tunnel and the top section in the Case_a_B series. The
Case_b_B series is for the ground which was improved around
all cross sections of the tunnel.
B
represents the width of each
improved area, varied between 6.0 m and 12.0 m. Only the area
around the crown of the tunnel was improved in Case_c.
The improved area of Case_a_7.0 was adopted in the
Ushikagi Tunnel (Tohoku Bullet Train line), that of Case_b_6.5
was adopted in the Kamikita and Akabira Tunnels (Tohoku
Bullet Train line), and that of Case_c was adopted in the
Dainiuozu and Uozukaminakazima Tunnels (Hokuriku Bullet
Train line). These three cases represent the basic patterns when
determining the areas for the pre-ground improved method.
The mechanical behavior of the ground and the tunnel for the
above three cases is investigated in this study, and the influence
of the width and the height of the improved areas is discussed.
3 EFFECT OF PRE-GROUND IMPROVEMENT METHOD
3.1
Mechanical behavior of the natural ground
Figure 5 shows the temporal changes in the settlements of the
ground surface, the crown and the foot of the tunnel. Case_0 is
the analysis pattern for the excavated tunnel without ground
improvement. The ground surface and the tunnel sink with large
values in Case_0. They become smaller with the improvement
of the ground, and the effect is seen to increase in the order of
the improved areas (Case_b_6.5 > Case_a_7.0 > Case_c). These
values in parentheses are the reduction ratios for each settlement
value from the Case_0.


