 
          1685
        
        
          Technical Committee 204 /


            Comité technique 204


          extraction induces changes in the values of CPT strength. This
        
        
          can be represented by Eq 2 as follows:


            q


            c


            (t)=N


            '


            v


            (t) = N


            '


            v0


            (t)+


            u(t))


          (2)
        
        
          Where


            N


          (Santoyo et al., 1989) is a correlation factor (


            N


          ≈
        
        
          5.5) and


            '


            v0(t


          )
        
        
          is the initial effective vertical stress. The factor


            u(t)


          represents the variation of pore pressure at the period
        
        
          under consideration. Evolution of shear wave velocity was
        
        
          estimated from equation 1, taking into account the changes in
        
        
          CPT strength over time. Evolution of these two parameters due
        
        
          regional subsidence is presented in Fig.4b y 4c.
        
        
          7 ANALYSIS OF RESULTS
        
        
          In the seismic analyses three scenarios were evaluated. The first
        
        
          corresponds for the present time, the second to 30 years in the
        
        
          future and the last one 50 years. These analyses were performed
        
        
          modifying the soil properties according to the proposed model
        
        
          explained at previous section. We analyze the resulting histories
        
        
          of acceleration, force and displacement.
        
        
          Eight monitoring points were fixed along the tunnel, in areas
        
        
          considered critical. These areas are the joints of tunnel and the
        
        
          stations and the zones where tunnel changes its direction
        
        
          (Elbow 1 and 2) (Figure 5). The monitoring points are located in
        
        
          sections of the upper and lower parts of the tunnel.
        
        
          Figure 5. Location of monitoring zones.
        
        
          7.1


            Evolution of the acceleration response


          The resulting acceleration spectra show that the maximum
        
        
          acceleration decreases with time (see Fig. 6). Table 1 shows that
        
        
          acceleration reductions at each monitored zone are different
        
        
          over 50 years, indicating clearly that the variation in the
        
        
          resulting accelerations will be unique at each site.
        
        
          Table 1. Variation of the acceleration magnitude between 2012 - 2062


            Monitoring zone


            Reduction of the


            acceleration magnitude


          Zapata station - Tunnel
        
        
          17.0
        
        
          Elbow 1
        
        
          17.0
        
        
          Elbow 2
        
        
          13.0
        
        
          Tunnel – Parque de los Venados station
        
        
          4.5


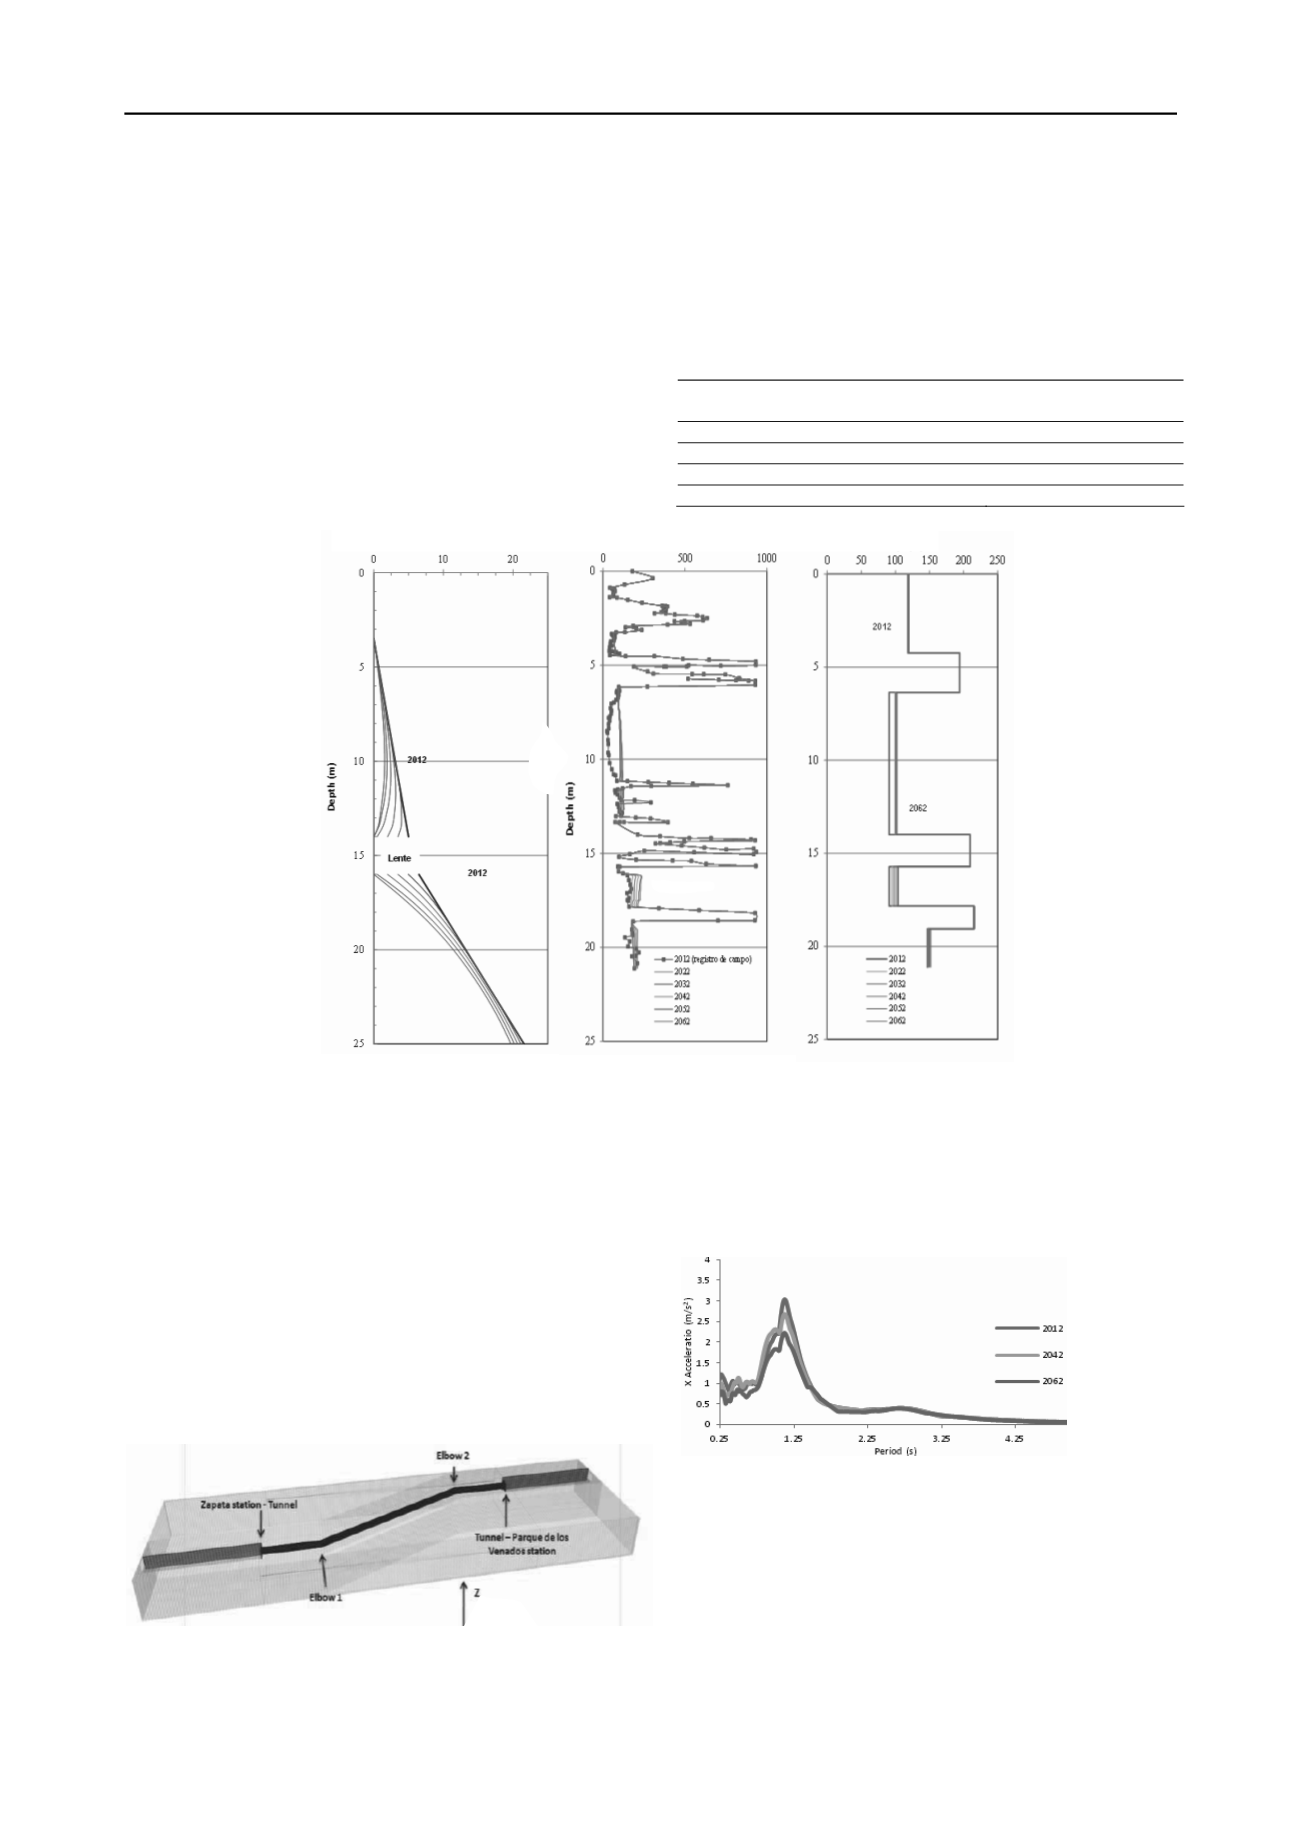
            Pore pressure distribution u (t/m²)                           CPT strength, qc (kg/cm²)                                                 Vs (m/s) 


          Ours results also show that the site dominant period is
        
        
          located at 1.12 s and that it presents a small decrease of less
        
        
          than 0.01 s over the 50 year period. This is due to the fact that
        
        
          soil properties at the site; do not vary significantly along time.
        
        
          Figure 4. Evolution of a) Pore pressure distribution, b) CPT Strength. c) Shear wave velocity, due regional subsidence.
        
        
          Figure 6. Evolution of the acceleration spectra over time. Case of Elbow
        
        
          1 in X direction.
        
        
          7.2


            Evolution of the relative displacements


          Relative displacements between 2012 and 2042 do not vary
        
        
          significantly but increase sharply between 2042 and 2062 where
        
        
          we estimated an increase of 32% on this period of time (see Fig.
        
        
          7).