1682
Proceedings of the 18
th
International Conference on Soil Mechanics and Geotechnical Engineering, Paris 2013
Although the general tendency of an initial support is toward
its eventual stabilization, in the Valley of Mexico, for example,
there are geotechnical zones of peculiar behavior, where subsoil
tension cracks appear that are associated to superficial drying
phenomena, and significant regional subsidence generated by
the overexploitation of aquifers that exist in the subsoil. Further,
the presence of channels that carry residual waters in the
vicinity of a tunnel under construction can provoke significant
changes on it due to the state of surrounding stresses, and
eventually on its k
0
relation if, for example, dredging maneuvers
are carried out on the channels, or if materials are loaded on
their borders.
3 GRAPHIC CRITERION TO IDENTIFY THE
DEFORMATIONAL BEHAVIOR OF A TUNNEL’S
SEGMENTS
With the information resulting from diametric measurements of
the mentioned drainage tunnel, a diagram was prepared, shown
in Fig 1, which includes five zones among which the curves of
“horizontal diameter increase” versus “time” can be set, as
recorded for each ring of the tunnel’s initial support. Table 1
shows an explanation of the control and mitigation
measurements recommended according to the case of
application.
2 1
20 cm
Topographicalmonitoring
Topographicalmonitoring
/ re-injection
0.0%
0.5%
1.0%
1.5%
2.0%
2.5%
3
6
9
12
15
18
4 cm
8 cm
12 cm
16 cm
6 cm
0.75%
METALLICFRAMES
2nd REINJECTION
1st REINJECTION
TOPOGRAPHICALMONITORING / RE-INJECTION
Topographicalmonitoring
1st stage
Metallic frames
2nd stage
}
Re-injection
Time (Months)
Horizontal diameter increase, %
ZONE 1
ZONE 2
ZONE 3
ZONE 4
ZONE 5
Figure 1. Diagram for deformational control of tunnel segments in soft
soils
4 APPLICATION EXAMPLES
Figures 2 and 3 show examples of the application of the graphic
criteria for the case of tunnels built in clayey deposits of the
Valley of Mexico, where a stable and unstable behavior are
observed. It is worth mentioning that the mitigation measures
adopted to reach stabilization in the second case were through
the application of re-injections at the point of contact of
segmented ring and soil.
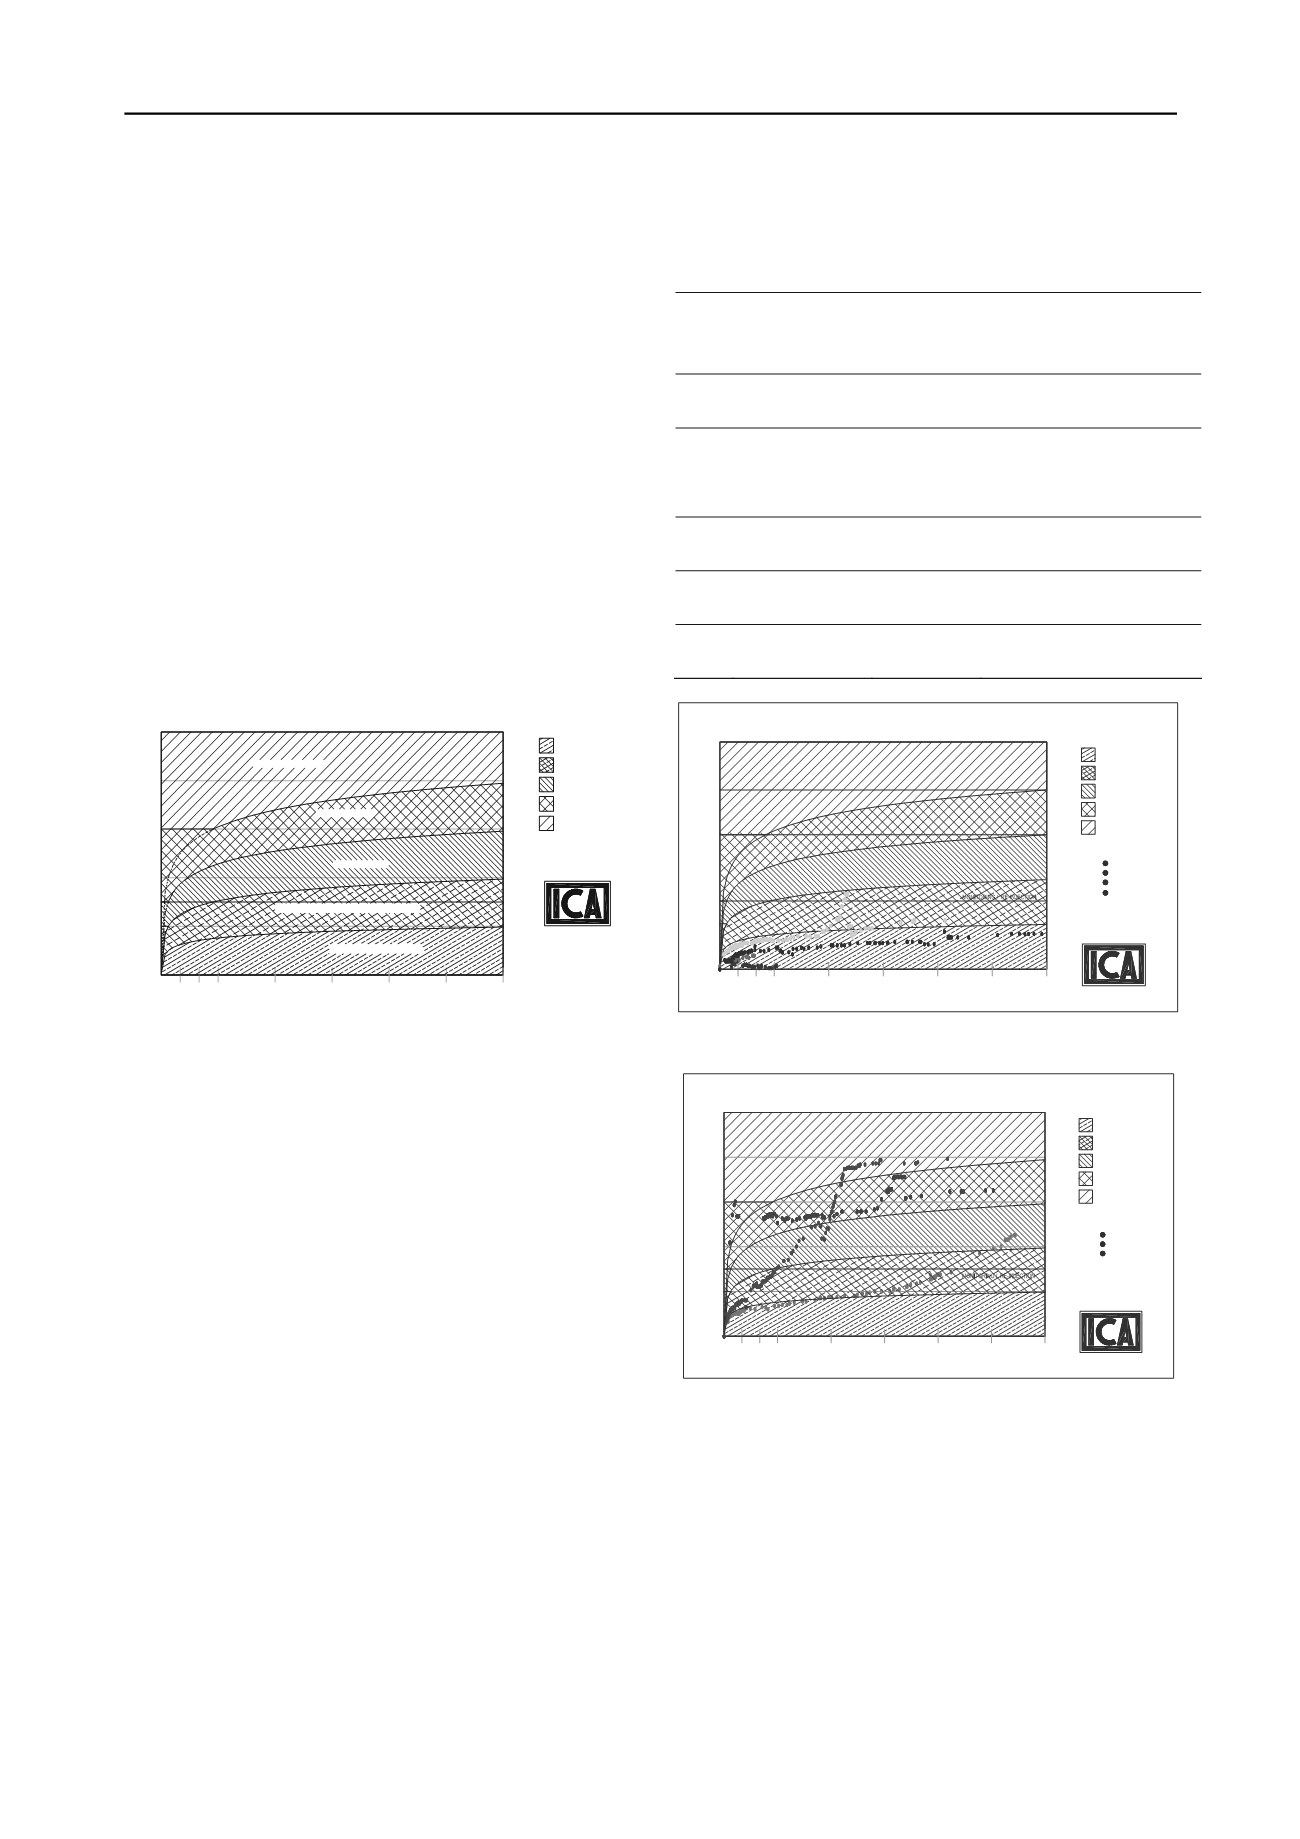
Figure 2 shows the variation in horizontal deformation of the
primary lining with respect to time for the case of a tunnel with
stable behavior. It was observed that initially there is an
important deformation speed of 0.5 mm/day, but the stable
tendency of the tunnel’s deformation began to be observed in
less than a month. Under these conditions there are no control or
mitigation measures, only the follow up of the tunnel’s
deformation until it reaches its total stabilization.
Figure 3 shows two cases of tunnels with stable behavior,
one since its construction, the other after reaching its apparent
stabilization. In both cases, the deformation speeds were high,
to the point that the deformation-time curve was located at
zones where it is necessary to apply re-injection at the point of
contact between segment and soil in order to ensure the tunnel
lining’s compression.
5 CONCLUSIONS
The deformational control of the initial support of an excavated
tunnel in very soft and compressible soils, where there are also
geotechnical aspects that can affect its relation with horizontal
and vertical stresses around the tunnel under construction, is a
useful tool to confirm their good behavior, or else to apply
opportune mitigation measures that will allow reaching their
desired stability, as was the case that occurred along a section of
the drainage tunnel this work refers to.
Table 1. Deformational control and mitigation measures
2 1
20 cm
Topographicalmonitoring
/ re-injection
0.0%
0.5%
1.0%
1.5%
2.0%
2.5%
3
6
9
12
15
18
4 cm
8 cm
12 cm
16 cm
6 cm
0.75%
DEFORMATIONAL CONTROL
TUNNEL IN SOFT SOILS
Topographicalmonitoring
1st stage
Metallic frames
2nd stage
}
Re-injection
Time (Months)
Horizontal diameter increase, %
RINGS
A-2
A-49
A-200
A-723
200
723
2
49
FRAMES
2nd REINJECTION
1stREINJECTION
TOPOGRAPHICAL
ZONE2
ZONE
ZONE
ZONE
ZONE 1
TOPOGRAPHICALMONITORING
3
4
5
Figure 2. Curves: Increase of horizontal diameter
versus
time showing
stable behavior
276
2 1
20 cm
Topographicalmonitoring
/ re-injection
0.0%
0.5%
1.0%
1.5%
2.0%
2.5%
3
6
9
12
15
18
4 cm
8 cm
12 cm
16 cm
6 cm
0.75%
DEFORMATIONAL CONTROL
TUNNEL IN SOFT SOILS
METALLIC FRAMES
2nd REINJECTION
1stREINJECTION
TOPOGRAPHICAL
Topographicalmonitoring
1st stage
Metallic frames
2nd stage
}
Re-injection
Time (Months)
Horizontal diameter increase, %
ZONE2
ZONE3
ZONE4
ZONE5
RINGS
A-684
A-556
684
556
A-276
ZONE 1
TOPOGRAPHICALMONITORING
Figure 3. Curves: Increase in horizontal diameter
versus
time, showing
unstable behavior whose tendency to deformation was mitigated by re-
injection.
6 REFERENCES
Ingenieros Civiles Asociados, 2011.
Registros topográficos del
comportamiento deformacional del Túnel Emisor Oriente
,
Technical Report, México, DF.
COMISSA, 2011.
Modelo geotécnico de los Tramos 1 y 2 del Túnel
Emisor Oriente
, Technical Report, México, DF.
Zone
Deformational
behavior
Horizontal
diameter
deformation
(%)
Mitigation action
1
Optimal,
with
marked tendency
to stability
0.0 to 0.5
Topographical monitoring
2
Slightly less than
optimal but with
marked tendency
to stability
< 1.0
Topographical monitoring and,
in case there is no logarithmic
behavior with tendency to
stabilization, re-injection of
ring’s annular space
3
Not optimal
< 1.5
Topographical monitoring and
first re-injection of ring’s
annular space
4
Notoriously not
optimal
< 2.0
Topographical monitoring and
second re-injection of ring’s
annular space
5
Critical,
with
marked tendency
to instability
> 2.0
Additionally reinforce initial
support by means of metallic
frames


