 
          1688
        
        
          Proceedings of the 18
        
        
          th
        
        
          International Conference on Soil Mechanics and Geotechnical Engineering, Paris 2013


            Proceedings of the 18


            th


            International Conference on Soil Mechanics and Geotechnical Engineering, Paris 2013


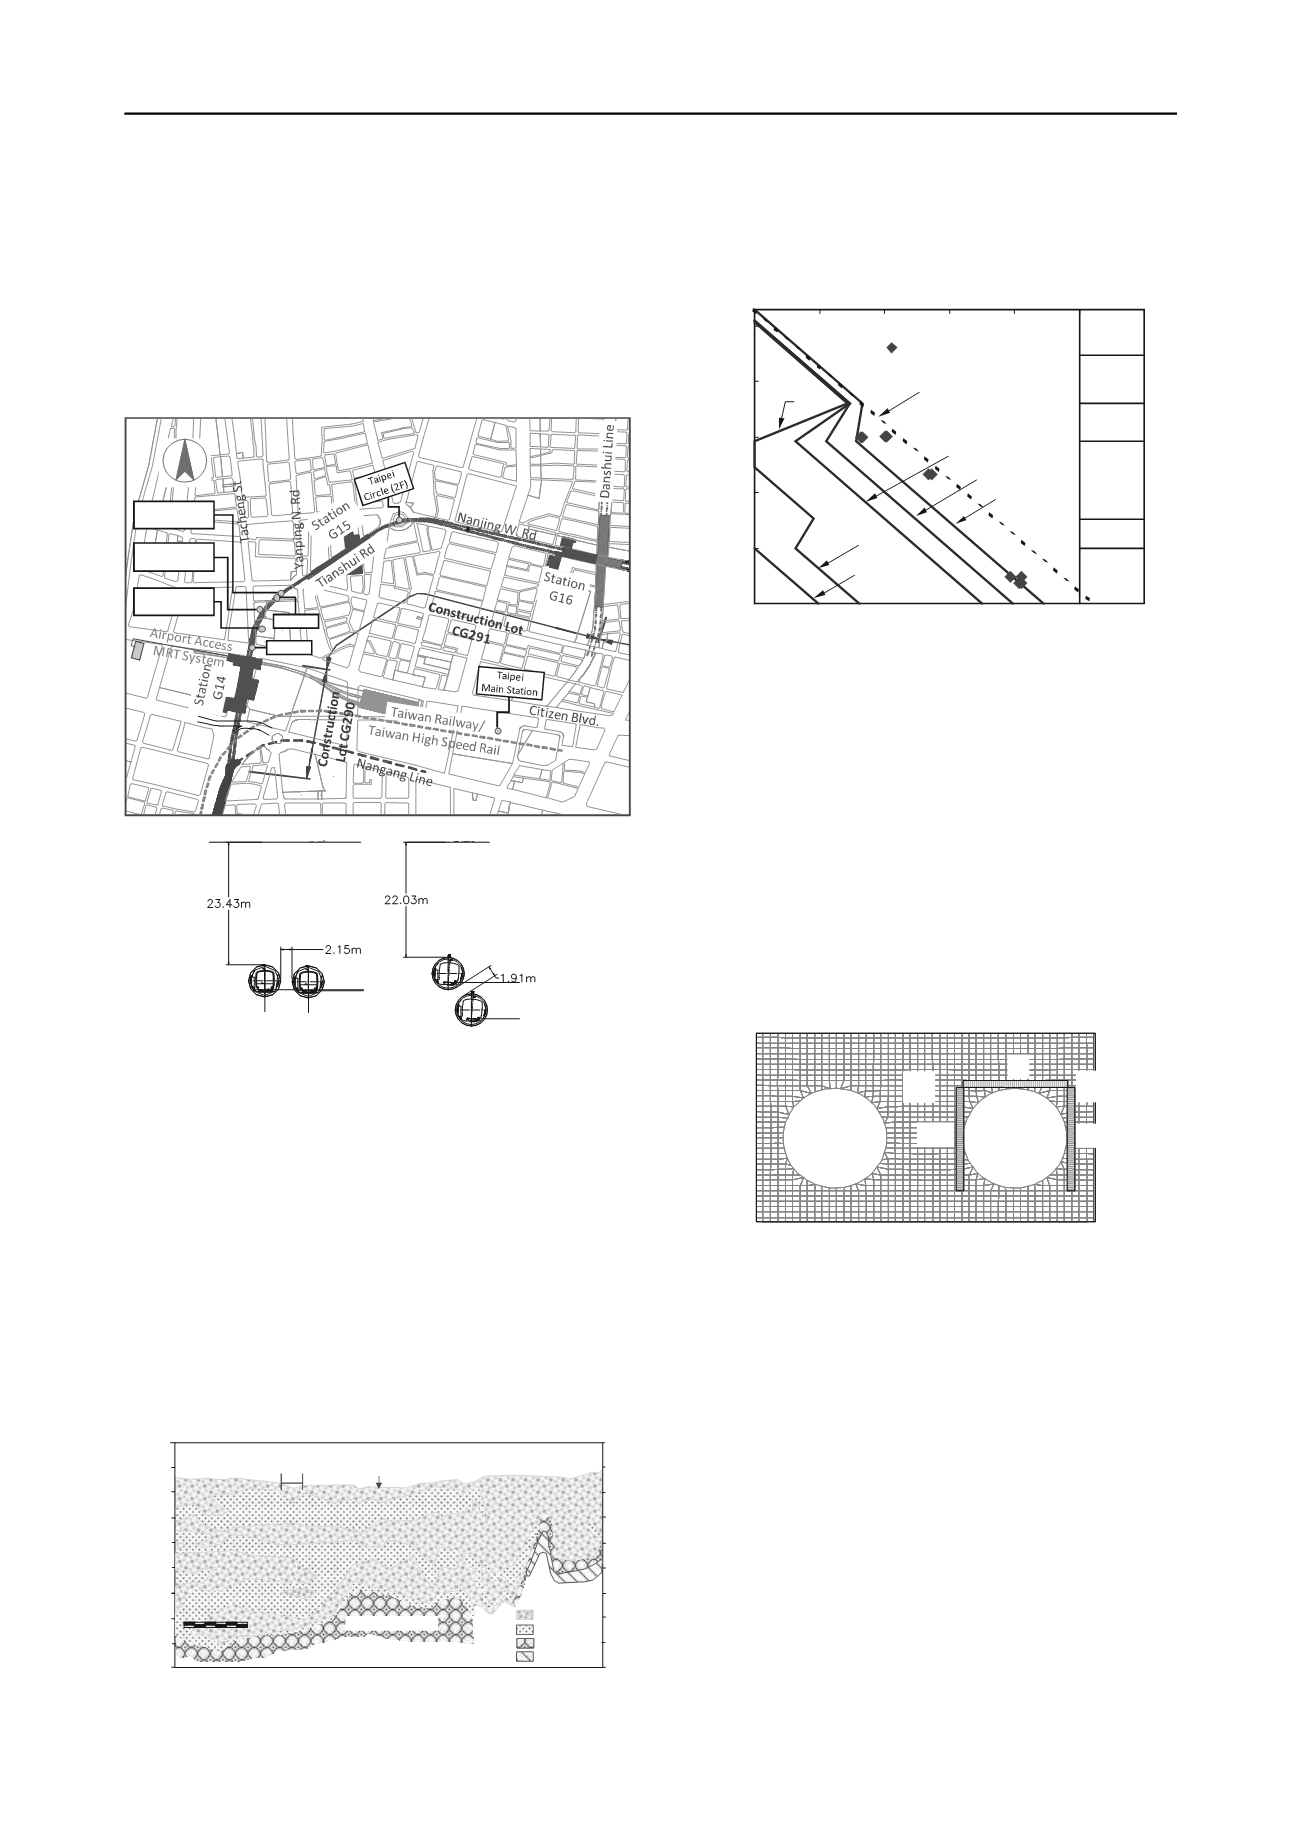
          residential buildings. Due to limited space on Tianshui Road,
        
        
          the twin tunnels are adjusted from the parallel alignment to a
        
        
          nearly stacked pattern for a section between the insection of
        
        
          Yanping N. Road and Tianshui Road and the Taipei Circle.
        
        
          According to the planned alignment, the clearance of the twin
        
        
          tunnels are smaller than 0.5 times of tunnel diameter for a
        
        
          section between Station G14 and the Taipei Circle. The smallest
        
        
          clearance is about 1.5 m that occurs right below the Taipei
        
        
          Circle. Typical sections of the twin tunnels in close proximity
        
        
          are as shown in Figure 2.
        
        
          Figure 1. Scope of work for Construction Lot CG291
        
        
          Figure 2. Typical sections of tunnels in close proximity (after Kang et.
        
        
          al 2007)
        
        
          The major geological strata that the CG291 would encounter
        
        
          is called Songshan Formation, a sandy-clayey-interbedded
        
        
          Holocene deposit that was formed through a series of fluvial,
        
        
          lacustrine, estuarine, and brackish-water sedimentation process
        
        
          on the Taipei Basin (e.g. Lin 1957). Figure 3 depicts the typical
        
        
          soil profile of Songshan Formation. It exhibits six sublayers at
        
        
          Taipei Main Station and the CG291 site or thereabout, named
        
        
          sublayer I to VI from the bottom to the top. The silty clay
        
        
          sublayers (i.e. sublayer II, IV, and VI) become dominant toward
        
        
          the east of the basin whereas the interbedded sequence becomes
        
        
          complex toward the west. Typical engineering properties of
        
        
          subsoils for Songshan Formation can be referred to Moh and Ou
        
        
          (1979).
        
        
          Figure 4 shows the historical variation of hydraulic pressure
        
        
          distribution with depth in Taipei City. After pumping was
        
        
          banned in 1968, the drawdown of hydraulic pressure has been
        
        
          recovered gradually. At present, hydrostatic condition at
        
        
          sublayers V and VI and about 50 kPa of drawdown at sublayers
        
        
          I to IV could be expected.
        
        
          Figure 4. Historical variation of hydraulic pressure distribution with
        
        
          depth in Taipei Basin (after Chin et al. 2006)
        
        
          3 NUMERICAL ANALYSIS
        
        
          The driving effect of the succeeding tunnel on the lining of the
        
        
          preceding one was investigated through a series of 2-
        
        
          dimensional (2-D) numerical analyses. Figure 5 shows the
        
        
          numerical model constructed using the computer program
        
        
          FLAC (ITASCA 2000). A Mohr-Coulomb model with non-
        
        
          associated plastic flow rule was adopted to simulate soil
        
        
          behavior. The driving-induced, construction and workmanship
        
        
          effect, such as delay of tail grouting (causing soil relaxation),
        
        
          excavation (inducing soil disturbance), and driving forces
        
        
          (increasing soil stress), were simulated by introducing the gap
        
        
          parameter suggested by Lee et al. (1992). The stresses shown on
        
        
          the figure represent average values obtained from the resulting
        
        
          response on top and two sides of the preceding tunnel.
        
        
          Representative results are described in the following
        
        
          paragraphs.
        
        
          Figure 5. Numerical model for twin tunnel analysis (after Kang et al.
        
        
          2007)
        
        
          Figure 6 depicts the variation of induced vertical stress on
        
        
          top of preceding tunnel with respect to tunnel clearance (defined
        
        
          as ratio of clearance to tunnel diameter). The three curves
        
        
          represent results obtained from three different depths of tunnels
        
        
          (i.e. z = 20, 25, and 30 m). As can be seen, the stress increases
        
        
          along with the decrease of tunnel clearance. While the tunnel
        
        
          clearance is 0.5, a 50% increase in vertical stress is obtained
        
        
          compared to the corresponding response for single tunnel cases.
        
        
          This finding is in a reasonable agreement with the suggested
        
        
          value by JRCEA (1977), as tabulated in Table 1. For tunnel
        
        
          clearance shrunk to 0.2, a 60% increase is expected. According
        
        
          to the results, the increase fades away as the tunnel clearance is
        
        
          greater than 2.
        
        
          On the other hand, Figure 7 shows the corresponding lateral
        
        
          stress variations on two sides of the preceding tunnel. For the
        
        
          stresses on the outer side, a similar trend with those shown in
        
        
          Figure 6 is obtained. The ratio of increase is however smaller.
        
        
          For the stresses on the inner side, an almost identical trend with
        
        
          those shown in Figure 6 is derived when the tunnel clearance is
        
        
          greater than 0.8. A remarkable drop of stress ratio is observed
        
        
          N
        
        
          BSS
        
        
          Underground
        
        
          ParkingLot (2B)
        
        
          OfficialBuilding
        
        
          (5F/3B)
        
        
          Residential
        
        
          Buildings (2~5F)
        
        
          0k+100
        
        
          0k+274
        
        
          -50
        
        
          -40
        
        
          -30
        
        
          -20
        
        
          -10
        
        
          0
        
        
          0
        
        
          100
        
        
          200
        
        
          300
        
        
          400
        
        
          500
        
        
          600
        
        
          Water pressure (kN/m
        
        
          2
        
        
          )
        
        
          Elevation  (m)
        
        
          Layer VI
        
        
          Layer V
        
        
          Layer IV
        
        
          Layer III
        
        
          Layer II
        
        
          Layer I
        
        
          Assumed
        
        
          hydrostatic
        
        
          pressure
        
        
          1997
        
        
          1974
        
        
          1980
        
        
          1990
        
        
          1986
        
        
          1980
        
        
          Year 2004 data
        
        
          Data before 1997  fromChin ( 1997 )
        
        
          SublayerVI
        
        
          (CL)
        
        
          SublayerV
        
        
          (SM)
        
        
          Sublayer IV
        
        
          (CL)
        
        
          Sublayer III
        
        
          (SM)
        
        
          Sublayer II
        
        
          (CL)
        
        
          Sublayer I
        
        
          (SM)


              FLAC (Version 4.00)


          LEGEND
        
        
          14-Dec-04  22:47
        
        
          step     29463
        
        
          -1.019E+01<x<  9.960E+00
        
        
          -3.472E+01<y< -1.458E+01
        
        
          Gridplot
        
        
          0
        
        
          5E  0
        
        
          -3.200
        
        
          -2.800
        
        
          -2.400
        
        
          -2.000
        
        
          -1.600
        
        
          (*10^1)
        
        
          -0.800
        
        
          -0.400
        
        
          0.000
        
        
          0.400
        
        
          0.800
        
        
          (*10^1)
        
        
          JOBTITLE :  CG2910+400 (ADJACENTTUNNEL) Z=25m,d=4.5m
        
        
          MohandAssociates,Inc.
        
        
          Taipei,Taiwam


            Foregoing


            Tunnel


            Second


            Tunnel


            V


          ) (


            inH


          ) (


            out


            H


            Inner


            Side


            Outer


            Side


          Preced
        
        
          el
        
        
          Succeeding
        
        
          Tunnel
        
        
          0k+100
        
        
          0k+274
        
        
          (a) Chainage 0+100 m (b) Chainage 0+274 m
        
        
          Tunnel diameter: 6.1m
        
        
          Panchiao
        
        
          Nankang
        
        
          Tamshui
        
        
          River
        
        
          TaipeiMain
        
        
          Station
        
        
          Silty Clay
        
        
          Silty Sand
        
        
          Gravel
        
        
          Sandstone
        
        
          Elevation (m)
        
        
          Songshan Formation
        
        
          20
        
        
          10
        
        
          0
        
        
          -10
        
        
          -20
        
        
          -30
        
        
          -40
        
        
          -50
        
        
          -60
        
        
          -70
        
        
          20
        
        
          10
        
        
          0
        
        
          -10
        
        
          -20
        
        
          -30
        
        
          -40
        
        
          -50
        
        
          -60
        
        
          -70
        
        
          ChingmeiGravels
        
        
          West
        
        
          East
        
        
          HorizonalScale
        
        
          0 1 2 3 km
        
        
          Figure 3. Typical stratification of Taipei Basin (after Chin et al. 1994)