1496
Proceedings of the 18
th
International Conference on Soil Mechanics and Geotechnical Engineering, Paris 2013
Proceedings of the 18
th
International Conference on Soil Mechanics and Geotechnical Engineering, Paris 2013
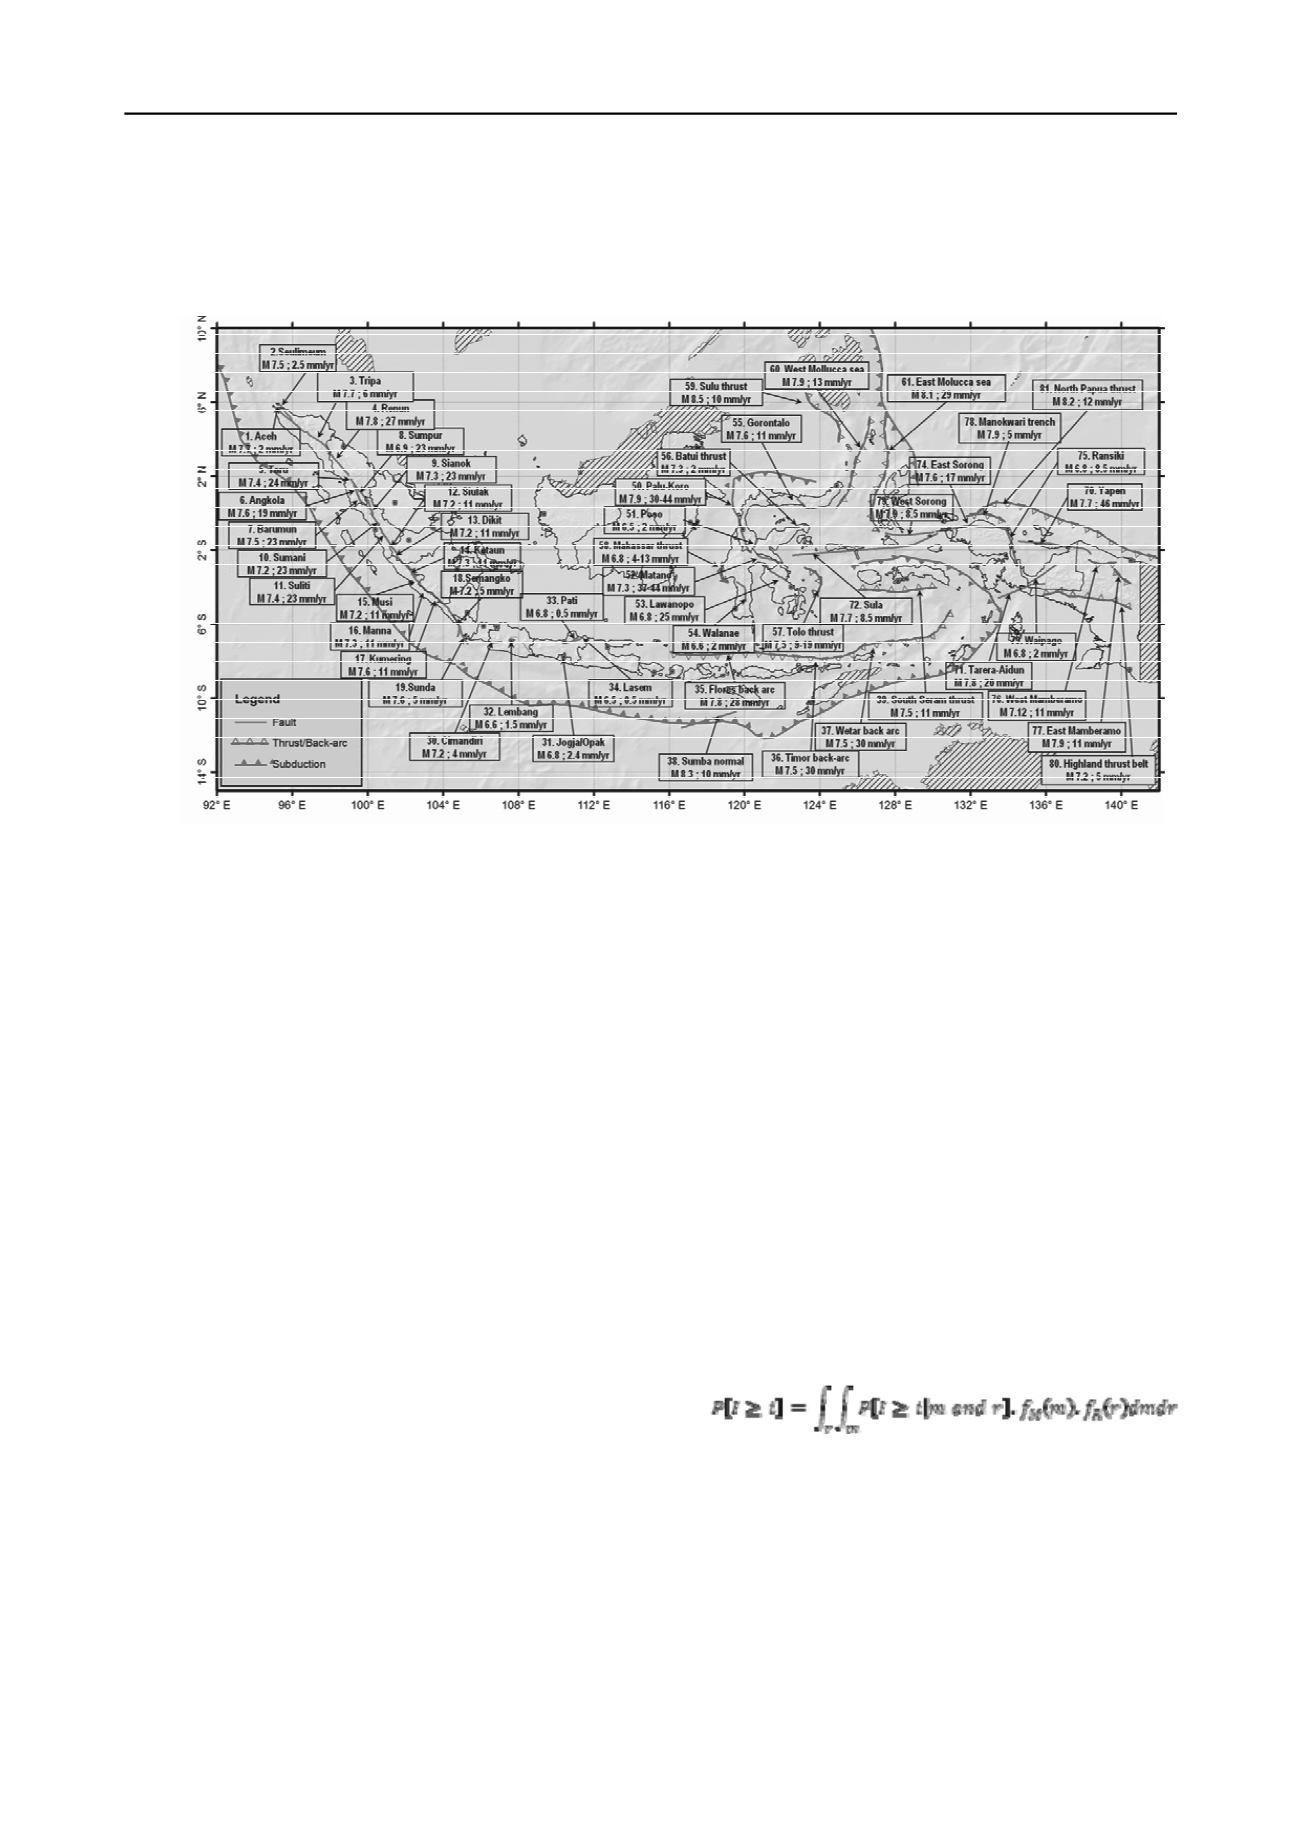
The seismic hazard parameters for each source zones
consisted of maximum magnitude and recurrence relationship
that included truncated exponential model and pure
characteristic model. Geometry of fault and subduction were
represented by three-dimensional (3D) models based on the
result of tomography, while slip-rates of faults were determined
by considering the results of GPS measurement. Maximum
magnitude and slip-rate of fault sources was summarized and
shown in Figure 1.
Figure 1. Maximum magnitudes and slip-rate of fault sources.
Background source zones were modeled using gridded
seismicity model based on spatially smoothed earthquake rates.
The gridded model was based on spatially smoothed earthquake
rates (Frankel, 1995). This model accounts for the observation
that larger earthquakes (M≥5) occur near smaller (M≥ 4 or 5)
earthquakes. Gridded seismicity included in the model was
based on earthquakes at five depth intervals: shallow (0-50 km),
intermediate (50–100 km and 100–150 km), and deep source
model (150–200 km and 200–300 km). A truncated-exponential
or Gutenberg-Richter (Gutenberg and Richter, 1944)
magnitude-frequency distribution between M5.0 and M6.5.0
was used to model rates for different sizes of earthquakes in
each grid cell or zone.
Several well-known attenuation functions were selected in
accordance with the mechanism of seismic source including the
Next Generation Attenuation (NGA). Logic tree was also
applied to account for epistemic uncertainty including
recurrence model, maximum magnitude, and several attenuation
functions.
3. SEISMIC HAZARD ANALYSIS
There are two methods commonly used in Seismic Hazard
Analysis (SHA), namely: deterministic (Deterministic Seismic
Hazard Analysis/DSHA) and probabilistic (Probabilistic
Seismic Hazard Analysis/PSHA) and both approaches have
been used for over 30 years. The results of SHA can be obtained
in the form of peak ground acceleration, response spectra, and
time-histories.
In general, DSHA is usually conducted in four stages
(Kramer, 1996); (1) identification and characterization of all
earthquake sources capable of producing significant ground
motion at the site including source locations and geometry,
focal mechanisms, earthquake history, and earthquake
recurrence relations, (2) determination of earthquake parameters
for certain scenario such as maximum magnitude and closest
distance to the site, (3) selection of the controlling earthquake
that is generally expressed in term of ground motion parameters,
(4) calculation of seismic design parameters such as peak
acceleration, peak velocity, and response spectrum ordinates
that is usually selected as the worst case scenario.
DSHA is usually applied to infrastructures for which failure
could have catastrophic consequences, such as nuclear power
plants and large dams. The advantages of this method are its
simplicity to apply and often conservative where the tectonic
features are well defined (line sources). The shortcomings of
this method are not providing the information for the level of
shaking that might be expected during a finite period of time
(such as the useful lifetime of a particular structure or facility),
producing a big (and perhaps unrealistic) result, and not
accounting the effects of uncertainties in the various step
required to compute the resulting ground motion characteristics
(Kramer, 1996).
PSHA was developed by McGuire (1995) is based on the
probability concept developed by Cornell (1968), which
assumed the earthquake magnitude M and the hypocenter
distance R as a continuous independent random variable.
Although the basic steps of the method remain the same up to
today, the models and the computational techniques of the
analysis keep being improved as the earth scientists and
engineers collect and process more information about
earthquakes. The total probability theorem can be represented in
the most basic form as follows,
Where,
f
= density function of magnitude
M
f
= density function of hypocenter distance.
R
P [I ≥ i |m and r]
= conditional probability of (random)
intensity I exceeding value i at the
site for a given earthquake
magnitude M and hypocenter
distance R.
The software from the USGS (Harmsen, 2007) was used for
the analysis. A site spacing of 0.1 degrees in latitude and
longitude were used in the analysis, so that the calculations of
seismic hazard for the Indonesia region are performed for more
than 96,600 sites. The ground motion parameters obtained from


