1492
Proceedings of the 18
th
International Conference on Soil Mechanics and Geotechnical Engineering, Paris 2013
compression as well as in extension region have to be
considered.
2
RESPONSE ENVELOPES
2.1
Concept
New or improved constitutive models need to be validated and
calibrated. This is often done with the aid of numerical element
tests, for example triaxial tests or oedometer tests.
So called response envelopes are a useful tool for calibrating,
validating and comparing constitutive equations (Sibille 2011,
Doanh 2000, Kolymbas 2000, Tamagnini 2006).
First basics of response-envelopes were presented in the
1970s by Lewin & Burland (1970). A few years later Gudehus
(1979) used this concept in context with the development of
constitutive equations.
To obtain a response-envelope, a soil element is subjected to
a certain stress- or strain-increment. The corresponding
“response” of the soil in form of either strain or stress is
determined and described graphically. The direction of the
implied stress- or strain increment with a constant absolute
value is then varied and leads to different stress- or strain
responses, endpoints of which are connected to a response-
envelope.
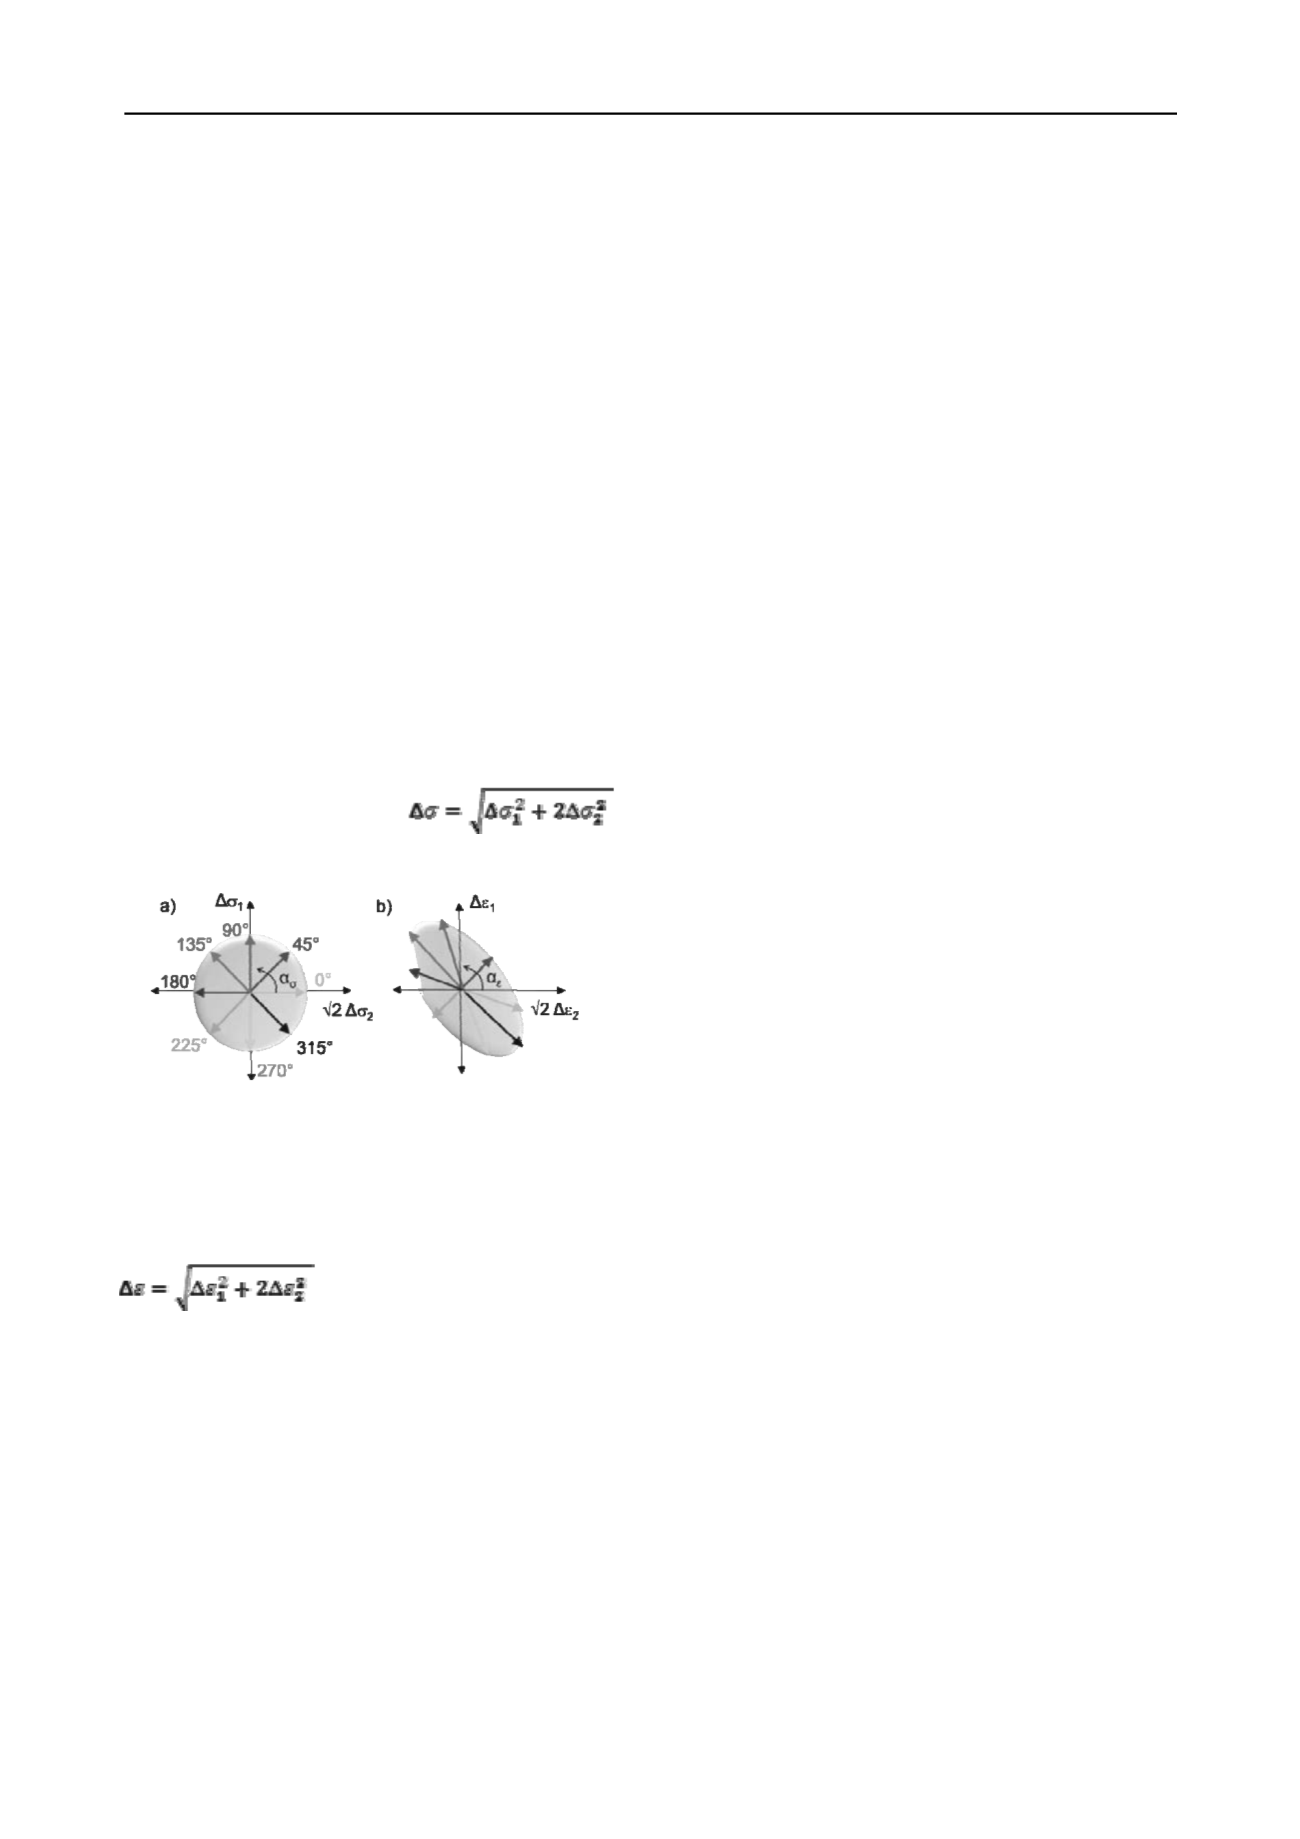
In figure 2 the strain-responses due to a constant stress
increment Δσ applied in 8 different directions α
σ
are shown.
Keeping the absolute value of
constant for all directions α
σ
, one gets a circle in the Rendulic-
plane with the axes √2
Δ
σ
2
and
Δ
σ
1
, figure 2a
Figure 2: Concept of strain response envelopes
a) applied stress increments
b) resulting strains
The α
σ
= 90°-stress-path in figure 2a for example is
equivalent to pure triaxial compression, in the same figure,
stress-path α
σ
= 180° stands for pure radial extension. The
strains are also plotted in the Rendulic-diagram (figure 2b),
where
the
resulting
strain-increment
is
.
The concept of response-envelopes is a convenient tool to
investigate the incremental stress-strain behaviour during first
loading as well as during un- and reloading-processes.
In this paper the quasi-elastic part of the strains, i.e. the
strains due to un- and reloading is investigated and evaluated by
means of strain-response-envelopes.
2.2
Literature
Only few experimental tests to obtain stress or strain response
envelopes can be found in literature.
Anandarajah et al. (1995) performed a series of stress-probe
experiments on dense and medium dense Ottawa sand to
investigate the dependence of magnitude and direction of
incremental plastic strain on direction of incremental stress. 6
different initial stress-states in compression were chosen and
stress increments from Δσ = 9 to 52 kPa in up to 10 different
directions were applied on triaxial specimens. The focus was set
on plastic strains, which were evaluated by subtracting the
elastic strains from the total strains. The elastic strains again
were either calculated “by using suitable elastic properties” or
determined by applying a stress cycle and measuring the elastic
strains during reversal.
Doanh (2000) for example describes tests producing strain-
response-envelopes at 3 different initial stress-states for dense
Hostun sand. The considered stress increment was
= 10 kN/m². For each direction, one soil-sample was used,
so that the determined strain increments can be interpreted as
total or elastoplastic strains after first loading. Quasi-elastic
strains were not determined separately.
Costanzo et al. (2006) performed several triaxial tests to
obtain strain-response-envelopes on a silty clay at 2 different
initial stress-states. The strains were investigated and plotted for
stress-increments between
= 20 to 90 kN/m². Quasi-elastic
strains were not considered explicitly either.
There is hardly any literature where “quasi-elastic” strain-
response-envelopes due to low cycle loading are presented.
There are quite some articles though, where quasi-elastic stress-
strain-behaviour is investigated after applying very small axial
or radial stress- or strain amplitudes (Ezaoui & Di Benedetto
2009, Hoque & Tatsuoka 1998, Kuwano et al. 2002).
3
RESULTS
3.1
Experimental fundamentals
The triaxial device used for the presented experiments is
equipped with high-resolution measurement- and control-
technology. The confining pressure as well as the axial force
can be controlled independently, so that any possible stress-path
from any initial stress-state can be followed. Height and
diameter of the soil specimen are 10 cm.
The tested soil is a fine grained sand with a low uniformity-
index (C
U
= 1,25 mm, d
50
= 0,15 mm). It could be shown by
different criterions (Nicholson et. al., 1993), that by using this
kind of sand, errors from bedding-effects and membrane-
penetration can be reduced significantly compared e.g. to
Karlsruhe middle-sand.
3.2
Testing procedure
Before running the triaxial tests the dry sand is pluviated to
obtain the soil sample and then the sample is saturated with
deaerated water. The specimen-preparation-method was kept
constant for all tests. The relative density varied between
I
D
= 0,6…0,7.
After saturating the soil sample, an initial stress state is
reached by first increasing the isotropic stress. Depending on
the position of the initial stress-state, either the vertical stress
(for stress-states in compression) or the horizontal stress (for
stress-states in extension) is then increased. Not only the mean
pressure p is varied, but also the deviator-stress q or the stress-
ratio η = q/p respectively.
Then stress cycles of relatively small stress increments of
Δ
≤ 50 kN/m² are applied in a certain direction α
σ
. To avoid
pore water pressure the frequency of the cycles is kept low.
The cyclic load in the first direction is repeated until the
measured strains are practically reversible or rather quasi-
elastic. The definition of “quasi-elasticity” implies that during
one cycle the plastic strains are less than 1…3 % of the total
strains, see Danne & Hettler (2011). It turns out that quasi-
elastic behaviour can occur after a low number of cycles. The
strain response of the last cycle is evaluated and plotted. After
that, the test is continued with the same stress increment Δ
, but
in a different direction α
σ
in the stress-space (figure 3a) until
quasi-elastic behaviour occurs again. The corresponding strains
of the last cycle are plotted in a diagram, figure 3b.


