1486
Proceedings of the 18
th
International Conference on Soil Mechanics and Geotechnical Engineering, Paris 2013
No Mean Min. Max.
SD
CoV (%)
w
L
13.
(%)
51
43.9
27.9 89.4
8
31.4
w
P
(%)
51
25.3
18.9 43.7
5.3
21.0
I (%)
P
51
18.6
5.8 49.0
9.7
52.1
(kN/m
3
)
1
25
19.0
7.8 22.6
1.2
6.1
Gr l
(%)
ave
31
48
0.2
0.0
3.0
0.7
1.6
Sand (%)
30.
99.
31.
48
0
0.0
5
9
106.5
Silt (%)
48
49.2
0.0 79.0 22.7
46.2
Clay (%) 48
20.6
0.0 77.0 17.2
83.7
Effective Stress E e:
+
'
nvelop
=
c'
'
tan
Type test
No
(kPa)
tan
'
' (°)
c'
R
2
DST
21
5.8 0.
0.947
472 29.2
TX
8
0.0 0.525 33.2 0.976
Shear strength envelope (
e
R
end of t st):
=
c
R
+
tan
Type test
No
c
R
(kPa)
tan
R
R
(°)
R
2
TX_CIU
7
15.0
0.453
24.4 0.851
G/G
0
vs.
:
0
1 +
)
G/G = 1 / (
Type test
No
R
2
RC
1 23.29
1.105 0.978
D vs. G/G
0
:
xp(
G/G
D = D
max
e
0
)
Type test
No
D
max
R
2
RC
1 44.58
-2.369 0.991
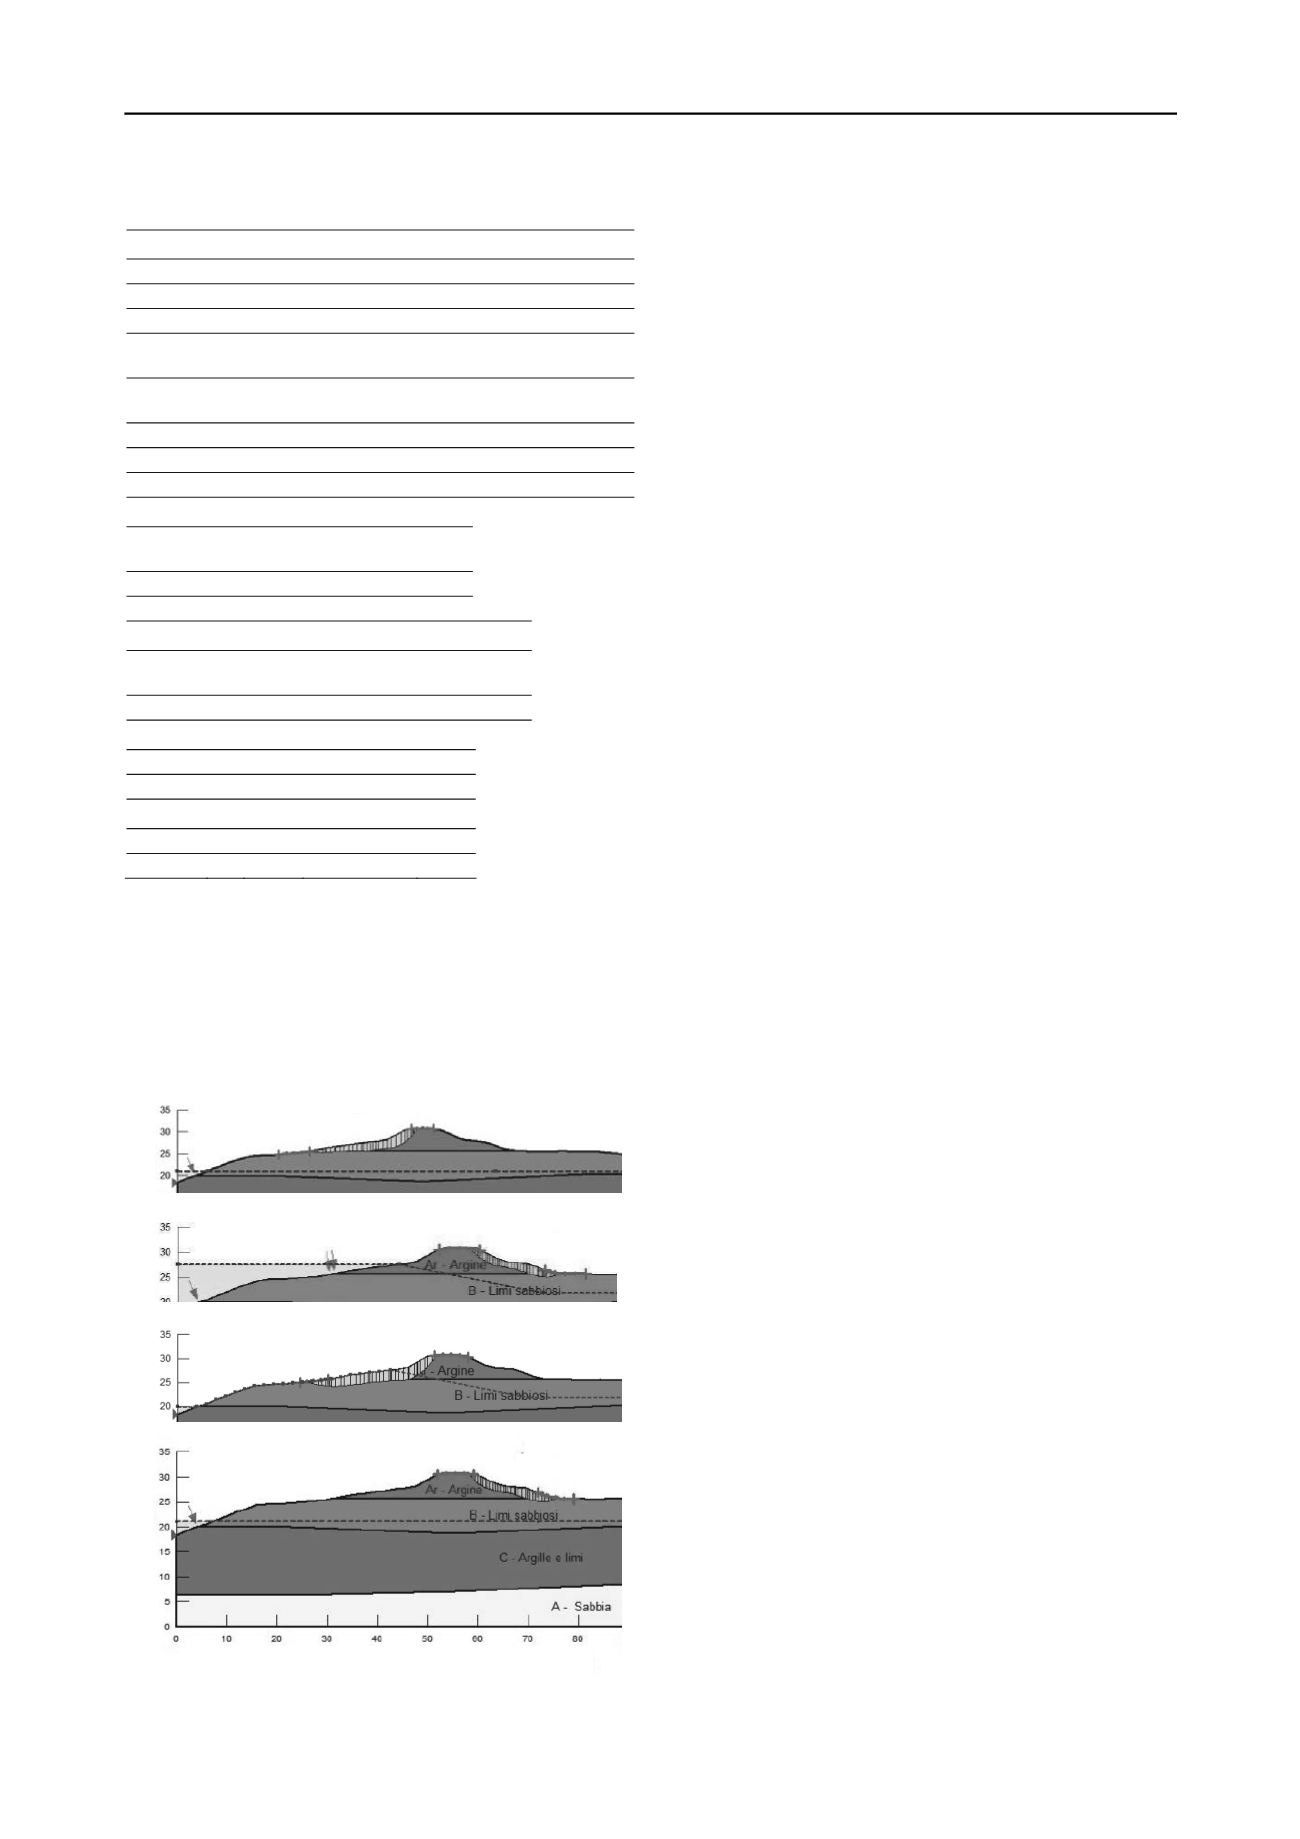
6 STATIC AND SEISMIC STABILITY ANALYSES
of the
side the embankment. The method of
Morgenstern and Price (1965) was used in the analyses. The
ch. A probability distribution was assigned
to
ts of an extensive investigation of the
ity conditions of more than 90 km of
S. G. and Wong K. S. 1990. Slope Stability
down.
Proc. of the H. Bolton Seed Memorial
Kul
Mo
rapid drawdown condition was also considered for the upstream
slope of the embankment. Since a complete drawdown is
unlikely for a river, the actual water level drop during
drawdown was deduced from hydrographs recorded in specific
sections of the Po River in the last ten years. A partial
drawdown of 8 m from the peak level was thus considered. The
simple and conservative effective stress approach was applied
in the drawdown analyses but, for the most critical situations,
further analyses will be developed using a staged undrained
strength method (Duncan et al., 1990). Dynamic effects in the
seismic condition were considered using the pseudostatic
method and, in this case, an ordinary water level. The values of
the (deterministic) factor of safety obtained for the most critical
conditions (upstream/downstream) on the section shown by way
of example are given in Figure 6. It is worth observing that the
most critical situation occurs during rapid drawdown for the
upstream slope and during earthquake shaking for the
downstream slope.
All the stability analyses were also developed following a
probabilistic approa
the input soil parameters using the result of the CPTU data
interpretation, and then a Monte Carlo procedure was applied to
evaluate a probability distribution of the resulting safety factors,
a more suitable way of assessing the risk level of instability of
each specific section.
7 CONCLUSIONS
The preliminary resul
static and seismic stabil
Limit equilibrium analyses for assessing the stability
riverbanks were performed under both static and seismic
conditions, as shown in Figure 6 by way of example. The
ordinary and the maximum water levels (peak flow) were
considered in static effective stress analyses, with steady
Figure 6. Typical output of deterministic stability analyses in static and
riverbanks along the most important Italian river have been
presented. The research included comprehensive experimental
field and laboratory geotechnical surveys. However, the length
of riverbanks considered together with the complexity of the
available experimental database required to develop a
methodology aimed at identifying the most representative
sections where focusing accurate stability analyses, based on
the probabilistic distribution of the main geotechnical
parameters. The final goal is to take into account the spatial
variability of soil units with a common geological origin and
repetitive features, in order to extend the results of the stability
analyses and to provide suitable risk maps of great relevance for
the management of such vital infrastructure.
8 REFERENCES
Duncan J. M., Wright
during Rapid Draw
Symp., May 1990,
Vol. 2, BiTech Publishers Ltd, Vancouver, BC,
Canada, pp 253-271.
hawy F.H. and Mayne P.W. 1990. Manual on Estimating Soil
Properties for Foundation Design.
Report EPRI EL-6800
, Electric
Power Research Institute (Palo Alto), 306 pp.
Martelli L., Severi P., Biaviati G., Rosselli S. 2011. Modello geologico
per le verifiche di stabilità in condizioni sismiche dell’argine destro
del Po tra Boretto (RE) e Ro (FE). Internal report. Regione Emilia-
Romagna, Servizio Geologico Sismco e dei Suoli (In Italian).
rgenstern N.R. and Price V.E. 1965. The Analysis of the Stability of
General Slip Surfaces. Geotechnique, 15, 79-93.
Phoon K-K and Kulhawy F.H. 1999. Characterization of geotechnical
variability.
Can. Geotech. J.
36, 612-624
Robertson P.K. and Campanella R.G. 1983. Interpretation of Cone
Penetration Tests: Sands.
Can. Geotech J.
20 (4), 1983, 719-733.
Robertson P.K. 2009. Interpretation of cone penetration tests – a unified
approach.
Can. Geotechnical J.
46 (11), 1337 – 1355.
Senneset K., Sandven R. and Janbu N. 1989. Evaluation of Soil
Parameters from Piezocone Tests.
Transportation Research Record
1235,
24-37, National Academy Press, Washington D.C.
FS
det
=2,013� RAPID�DRAWDOWN�
FS
det
=2,497�
PEAK�FLOW�
FS
det
=2,149�
PSEUDOSTATIC�ANALYSIS�–�DOWNSTREAM�
(K
h
=0,0446,�K
v
=‐0,0223)�
ORDINARY�LEVEL�
�
Fs
det
=3,003�
FS
det
=2,149�
PSEUDOSTATIC�ANALYSIS�
K
h
=0,0446�e�K
v
=‐0,0223�
Depth�a.s.l.��[m]�
Distance�[m]�
seismic conditions.
seepage flow in
No Mean Min. Max.
SD
CoV (%)
w
L
13.
(%)
51
43.9
27.9 89.4
8
31.4
w
P
(%)
51
25.3
18.9 43.7
5.3
21.0
I (%)
P
51
18.6
5.8 49.0
9.7
52.1
(kN/m
3
)
1
25
19.0
7.8 22.6
1.2
6.1
Gr l
(%)
ave
31
48
0.2
0.0
3.0
0.7
1.6
Sand (%)
30.
99.
31.
48
0
0.0
5
9
106.5
Silt (%)
48
49.2
0.0 79.0 22.7
46.2
Clay (%) 48
20.6
0.0 77.0 17.2
83.7
Effective Stress E e:
+
'
nvelop
=
c'
'
tan
Type test
No
(kPa)
tan
'
' (°)
c'
R
2
DST
21
5.8 0.
0.947
472 29.2
TX
8
0.0 0.525 33.2 0.976
Shear strength envelope (
e
R
end of t st):
=
c
R
+
tan
Type test
No
c
R
(kPa)
tan
R
R
(°)
R
2
TX_CIU
7
15.0
0.453
24.4 0.851
G/G
0
vs.
:
0
1 +
)
G/G = 1 / (
Type test
No
R
2
RC
1 23.29
1.105 0.978
D vs. G/G
0
:
xp(
G/G
D = D
max
e
0
)
Type test
No
D
max
R
2
RC
1 44.58
-2.369 0.991
6 STATIC AND SEISMIC STABILITY ANALYSES
of the
side the embankment. The method of
Morgenstern and Price (1965) was used in the analyses. The
ch. A probability distribution was assigned
to
ts of an extensive investigation of the
ity conditions of more than 90 km of
S. G. and W ng K. S. 1990. lope Stability
d wn.
Proc. of the H. Bolton Seed Memorial
Kul
Mo
rapid drawdown condition was also considered for the upstream
slope of the embankment. Since a complete drawdown is
unlikely for a river, the actual water level drop during
drawdown was deduced from hydrographs recorded in specific
sections of the Po River in the last ten years. A partial
drawdown of 8 m from the peak level was thus considered. The
simple and conservative effective stress approach was applied
in the drawdown analyses but, for the most critical situations,
further analyses will be developed using a staged undrained
strength method (Duncan et al., 1990). Dynamic effects in the
seismic condition were considered using the pseudostatic
method and, in this case, an ordinary water level. The values of
the (deterministic) factor of safety obtained for the most critical
conditions (upstream/downstream) on the section shown by way
of example are given in Figure 6. It is worth observing that the
most critical situation occurs during rapid drawdown for the
upstream slope and during earthquake shaking for the
downstream slope.
All the stability analyses were also developed following a
probabilistic approa
the input soil parameters using the result of the CPTU data
interpretation, and then a Monte Carlo procedure was applied to
evaluate a probability distribution of the resulting safety factors,
a more suitable way of assessing the risk level of instability of
each specific section.
7 CONCLUSIONS
The preliminary resul
static and seismic stabil
Limit equilibrium analyses for assessing the stability
riverbanks were performed under both static and seismic
conditions, as shown in Figure 6 by way of example. The
ordinary and the maximum water levels (peak flow) were
considered in static effective stress analyses, with steady
Figure 6. Typical output of deterministic stability analyses in static and
riverbanks along the most important Italian river have been
presented. The research included comprehensive experimental
field and laboratory geotechnical surveys. However, the length
of riverbanks considered together with the complexity of the
available experimental database required to develop a
methodology aimed at identifying the most representative
sections where focusing accurate stability analyses, based on
the probabilistic distribution of the main geotechnical
parameters. The final goal is to take into account the spatial
variability of soil units with a common geological origin and
repetitive features, in order to extend the results of the stability
analyses and to provide suitable risk maps of great relevance for
the management of such vital infrastructure.
8 REFERENCES
Duncan J. M., Wright
during Rapid Draw
Symp., May 1990,
Vol. 2, BiTech Publishers Ltd, Vancouver, BC,
Canada, pp 253-271.
hawy F.H. and Mayne P.W. 1990. Manual on Estimating Soil
roperties for Foundation Design.
Report EPRI EL-6800
, Electric
Power Research Institute (Palo Alto), 306 pp.
Martelli L., Severi P., Biaviati G., Rosselli S. 2011. Modello geologic
per le verifiche di stabilità in condizioni sismiche dell’argine destro
del Po tra Boretto (RE) e Ro (FE). Internal rep rt. Regione Emilia-
Romag a, Servizio Geologico Sismco e dei Suoli (In Italian).
rgenstern N.R. and Price V.E. 1965. The Analysis of the Stability of
General Slip Surfaces. Geotechnique, 15, 79-93.
Phoon K-K and Kulhawy F.H. 1999. Characterization of geotechnical
variability.
Ca . Geotech. J.
36, 612-624
Robertson P.K. and Campanella R.G. 1983. Interpretation of Cone
Penetration Tests: Sands.
Can. Geotech J.
20 (4), 1983, 719-733.
Robertson P.K. 2009. Interpretation of cone penetration tests – a unified
approach.
Ca . Geotechnical J.
46 (11), 1337 – 1355.
Senneset K., Sandven R. and Janbu N. 1989. Evaluation of Soil
Parameters from Piezocone Tests.
Transportation Research Record
1235,
24-37, National Academy Press, Washington D.C.
FS
det
=2,013� RAPID�DRAWDOWN�
FS
det
=2,497�
PEAK�FLOW�
FS
det
=2,149�
PSEUDOSTATIC�ANALYSIS�–�DOWNSTREAM�
(K
h
=0,0446,�K
v
=‐0,0223)�
ORDINARY�LEVEL�
�
Fs
det
=3,003�
FS
det
=2,149�
PSEUDOSTATIC�ANALYSIS�
K
h
=0,0446�e�K
v
=‐0,0223�
Depth�a.s.l.��[m]�
Distance�[m]�
seismic conditions.
seepage flow in
order to
property
tionships
with the
rrelations
later by
effective
ized CPT
eset
et al.
ratory testing for lithologic
Unit A
r
*.
representative samples of lithologic Units Ar* are shown in
Table 1. In particular, for each property, the number of tested
specimens, mean, minimum and maximum values, standard
deviation and coefficient of variation are reported. Kind of
testing, number of specimens, values of the parameters and
correlation coefficients are provided for drained and undrained
shear strength and for normalized shear modulus and damping
ratio versus shear strain relationships.
Table 1. Geotechnical properties from labo
No Mean Min. Max.
SD
CoV (%)
L
13.
(%)
43.9
27.9 89.4
8
31.4
w
P
( )
25 3 18 9 3 7 5 3
21 0
I (%)
P
51
18.6
5.8 49.0
9.7
52.1
(kN/m
3
)
1
25
19.0
7.8 22.6
1.2
6.1
Gr l
(%)
ave
31
48
0.2
0.0
3.0 0 7
1 6
and (%)
30
9
31
4
0
5
9
10 5
Silt (%)
8
49.2
0.0 79.
22 7
46.2
Clay (%) 48
20.6
0.0 77.0 17.2
83.7
Effective Stress E e:
+
'
nvelop
=
c'
'
tan
Type test
No (kPa) tan
'
' (°)
c'
R
2
DST
21 5 8
47
472 29
TX
8
0.0 0.525 33.2 0.976
Shear strength envelope (
e
R
end of t st):
=
c
R
+
tan
ype test
No
c
R
(kPa)
tan
R
R
(°)
R
2
TX_CIU
7
15.0
0.453
24.4 0.851
G/G
0
vs.
:
0
1 +
)
G/G = 1 / (
Type test
No
R
2
RC
1 23.29
1.105 0.978
D vs. G/G
0
:
xp(
G/G
D =
e
0
)
Type test
No D
max
R
2
RC
1 44.58
-2.369 0.991
6 STATIC AND SEIS IC STABILITY ANALYSES
of the
side the embankment. The method of
orgenstern and Price (1965) was used in the analyses. The
ch. A probability distribution was assigned
to
ts of a exte sive inv s ig tion of the
ity conditions of more than 90 km of
S. G. and ong K. S. 1990. Slope Stability
down.
Proc. of the H. Bolton Seed Memorial
Kul
Mo
rapid drawdown condition was also considered for the upstream
slope of the embankment. Since a complet drawdown is
unlikely for a river, the actual water level drop during
drawdown was deduced from hydrographs recorded in s ecific
sections of the Po Riv r in the last ten years. A partial
drawdown of 8 m from the peak level was thus considered. The
simple and conservative effective stress approach was applied
in
drawdown analyses but, for the most critical situations,
further analyses will be developed using a staged undrained
trength method (Duncan et al., 1990). Dynamic effects in the
seismic condition were c nsidered using the pseudostatic
method and, in this case, an ordinary water level. The values of
the (deterministic) factor of safety obtained for the most critical
conditions (upstream/downstream) on the section shown by way
of example are given in Figure 6. It is worth observing that he
most critica situation occurs during rapid drawdown for h
upstream slope and during earthquake shaking for the
downstream slope.
All the st bility analyses were also developed follow ng a
probabilistic approa
the input soil parameters using the result of the CPTU data
interpret tion, and then a onte Carlo procedure was applied to
evaluate a probability distribution of the resulting safe y factors,
a more suitabl way of assessing the risk level of instability of
each specific section.
7 CONCLUSIONS
The preliminary resul
static and seismic stabil
Limit equilibrium analyses for assessing the stability
riverbanks were performed under both static and seismic
conditions, as shown in Figure 6 by way of example. Th
ordinary and he maximum water level (peak flow) were
considered in static effectiv stress analyses, with teady
Figure 6. Typical output of deterministic stability analyses in static and
riverbanks along the most important Italian river have been
presented. The research included comprehensive experimental
field and laboratory geotechnical surveys. However, the length
of riverbanks considered together with the complexity of the
available experimental atabase required to d velop a
methodology aimed at identifying the most r presentative
sections where focus ng accurate stability analyses, based on
the probabilistic distribut on of the main geotechnic
p ameters. The final goal is to take into account the spatial
variab lity of soil u its with a common g ological origin and
repetitive fea ures, in order to extend the results of the stability
analyses and to provide suit ble risk maps of great relevance for
the management of such vital infrastructure.
8 REFERENCES
Duncan J. M., Wright
during Rapid Draw
Symp., May 1990,
Vol. 2, BiTech Publishers Ltd, Vancouver, BC,
Canada, pp 253-271.
hawy F.H. and Mayne P.W. 1990. Manual on Estimating Soil
Properties for Foundation Design.
Report EPRI EL-6800
, Electric
Power Research Institute (Palo Alto), 306 pp.
Martelli L., Severi P., Biaviati G., Rosselli S. 2011. Modello geologico
p r le verifiche di stabilità in condizioni sismiche dell’argine destro
del Po tra Boretto (RE) e Ro (FE). Internal report. Regione Emilia-
Romagna, Servizio Geologico Sismco e dei Suoli (In Italian).
rgenstern N.R. and Price V.E. 1965. The Analysis of the Stability of
General Slip S rfaces. Geotechnique, 15, 79-93.
Phoon K-K and Kulhawy F.H. 1999. Characterization of geotechnical
variability.
Can. Geotech. J.
36, 612-624
Robertson P.K. and Campanella R.G. 1983. Interpretation of Cone
Penetration Tests: Sands.
Can. Geotech J.
20 (4), 1983, 719-733.
Robertson P.K. 2009. Interpretation of cone penetration tests – a unified
approach.
Ca . Geotechnical J.
46 (11), 1337 – 1355.
Senneset K., Sandven R. and Janbu N. 1989. Evaluation of Soil
Parameters from Piezocone Tests.
Transportation Research Record
1235,
24-37, National Academy Press, Washington D.C.
FS
det
=2,013� RAPID�DRAWDOWN�
FS
det
=2,497�
PEAK�FLOW��
FS
det
=2,149�
PSEUDOSTATIC�ANALYSIS�–�DOWNSTREAM�
(K
h
=0,0446,�K
v
=‐0,0223)�
ORDINARY�LEVEL��
�
Fs
det
=3,003�
FS
det
=2,149�
PSEUDOSTATIC�ANALYSIS�
K
h
=0,0446�e�K
v
=‐0,0223�
Depth�a.s.l ��[m]�
Distance�[m]�
eismic conditions.
seepage flow in
No Mean Min. Max.
SD
CoV (%)
w
L
13.
(%)
51
43.9
27.9 89.4
8
31.4
w
P
(%)
51
25.3
18.9 43.7
5.3
21.0
I (%)
P
51
18.6
5.8 49.0
9.7
52.1
(kN/m
3
)
1
25
19.0
7.8 22.6
1.2
6.1
Gr l
(%)
ave
31
48
0.2
0.0
3.0
0.7
1.6
Sand (%)
30.
99.
31.
48
0
0.0
5
9
106.5
Silt (%)
48
49.2
0.0 79.0 22.7
46.2
Clay (%) 48
20.6
0.0 77.0 17.2
83.7
Effective Stress E e:
+
'
nvelop
=
c'
'
tan
Type test
No
(kPa)
tan
'
' (°)
c'
2
DST
21
5.8
.
0.947
472 29.2
TX
8
0.0 0.525 33.2 0.976
Shear strength envelope (
e
R
end of t st):
=
c
R
+
tan
Type test
No
c
R
(kPa)
tan
R
R
(°)
R
2
TX_CIU
7
15.0
0.453
24.4 0.851
G/G
0
vs.
:
0
1 +
)
G/G = 1 / (
Type test
No
R
2
RC
1 23.29
1.105 0.978
D vs. G/G
0
:
xp(
G/G
D = D
max
e
0
)
Type test
No
D
max
R
2
RC
1 44.58
-2.369 0.991
6 STATIC AND SEISMIC STABILITY ANALYSES
of the
ch. A probability distributi n was assigned
to
ts of an extensive investigation of the
ity conditions of more than 90 km of
rapid drawdown condition was also considered for the upstream
slope of the embankment. Since a complete drawdown is
unlikely for a river, the actual water level drop during
drawdown was deduced from hydrographs recorded in specific
sections of the Po River in the last ten years. A partial
drawdown of 8 m from the peak level was thus considered. The
simple and conservative effective stress approach was applied
in the drawdown analyses but, for the most critical situations,
furt er analyses will be developed using a staged undrained
strength method (D ncan et al., 1990). D namic effects in the
seismic condition were considered using the pseudostatic
method and, in this case, an ordinary water level. The values of
the (deterministic) factor of safety obtai ed for the m st critical
conditions (upstream/downstream) on the section shown by way
of example are given in Figure 6. It is worth observing that the
most critical situation occurs during rapid drawdown for the
upstream slope and during earthquake shaking for the
downstream slope.
All the stability analyses were also developed following a
prob bilistic approa
the i put soil parameters using the result of the CPTU data
interpretation, and then a Monte Carlo procedure w s applied to
evalu te a probability distribution of the resulting safety factors,
a more suitable way of assessing the risk level of inst bility f
each specific section.
7 CONCLUSIONS
The preliminary resul
static and seismic stabil
Limit equilibrium analyses for assessing the stability
riverbanks were performed under both static and seismic
conditions, as shown in Figure 6 by way of example. The
ordinary and the maximum water levels (peak flow) were
considered in static effective stress analyses, with steady
Figure 6. Typical output of deterministic stability analyses in static and
riverbanks along the most important Ital an river have been
presented. The research included comprehensiv experimental
field a d laboratory geotechnical surveys. However the length
of riverbanks considered ogether with the complexity of the
available experim ntal d tabase required to develop a
methodology aimed at identifying the most representative
sections where focusing accurate stability analyses, based n
the probabilistic distribution of the main geotechnical
parameters. The final goal is to take into account the spatial
variability of soil units with a common geological origin and
repetitive features, in order to extend the results of the stability
analyses and to provide suitable risk maps of great relevance for
the management of such vital infrastructure.
FS
det
=2,149�
PSEUDOSTATIC�ANALYSIS�–�DOWNSTREAM�
(K
h
=0,0446,�K
v
=‐0,0223)�
ORDINARY�LEVEL�
�
Fs
det
=3,003�
M a M
SD
C V ( )
%)
43.9
.9
.
52 1
(%)
48
0.2
0.0
3.0
Sand (%)
30.
99.
31.
48
0
0.0
5
9
106.5
Silt (%)
48
49.2
0.0 79.0 22.7
46.2
'
c'
'
6
elope (
e
n f t st :
+
an
c
Type test
RC
R
1 4 58
T IC A S IS IC STA L TY AN SES
o he
i
t
mb n me t. T e me d of
r s n a r
s s n he a a ses The
. A p b l
dist ib ion w a i
to
v
s a i
th
ity
ion of mo e a k o
S. . an ng K . 199 S ope S bility
own.
roc. of t e H.
lto S d Memoria
K
wdown onditio was a s ns der for t e up t eam
h
bankmen . nce a om lete r w wn is
f
iv r t e a al w er ev l d d g
do s ed c d om ydro r
r orde in s e i c
s cti s o t e Po
in
l en ea A pa t l
d awd n of 8 m from th p k l
s thus c side d. he
s pl
d on r ative
i e t es
oac wa app ied
fu th nalys s will be developed si
a
ed u dr ned
str g h
h (
can et l.,
. D nam ffe s in th
eis c
ndi i n re con i e us n e pseud stati
met
, n this case, a rd ry a r le . h val e of
( t m f c
t e s ri a
con i s
tr a ow
c h
ple r g ven n i ur . t i w rth ob erv n th the
m s ritica situatio c r uring r d aw own h
e m slope
d
r n a thqua e sh ing
nstream s ope
robabili t c a p a
h i put soil par et r usi g t e r s lt f he
i t r retati a t e
arlo pr cedur w s ap ied to
e a o l ty istrib t on o h resul n e f c rs,
e s i ab wa o a es in
sp if c o
T p i
r
an seism sta il
im t e
u a s r s e i
e
i i
b nks
r
e d
t i
s m c
onsidered in static fectiv
Figur 6. y al utput of de rm n s sta i
n ly e
r
nk n the s i por n Ital an ive v b e
m rehens v per m ta
f d
bo at o hni a v H
l g
of r v rba ks co d re
r
the co plex ty o e
av i ab
er
l dat se r quire to
elop a
method l y med at i
n h m r e
ve
aly , b ed on
ba istic dis rib ion
the main g o h cal
p
h f nal oa is t a e into a nt h spa ia
n
n
g nd
rep titive featu e , i ord to extend the r sul s f t s abil ty
a a se and to provi suitable ris map
r t l v c fo
t e na e t of s vi l n ra truc
D an . M , right
d ri Rapi ra
May
0,
V l 2 Bi c ub s s L d V ncou r, BC
p 53-
h y .H a d ay e P . 9 . Man a n E timating Soi
Pro ies for oun ti n De ig
e rt PRI EL 68
, le c
c
ute (P lo Alto) 306 pp
M te l L , ev r ., avia G. R e li S 0 1 od llo geo o i
r l veri h d bi it n con izi i s smiche del ’ar n e tro
l o ra B ret o (R ) e R E te a repo . egi
m l a
R a a,
r i io G ologi Sis c d i Suoli (I It an .
r ns e R and P ic
. 1 6 he A lysis he Sta t
ac
c q , 5, 7 .
h on - a d Kulh wy F.H 19 9. Ch ac riza i n f g ot c ica
r ability
Can Geo e h. J.
36, 612- 2
rtso . .
mpa ll
.G 1983. Inter r a n
e
Pen ra io es s: an s.
C n. eo e h .
2 (4), 1 83, 719- 33.
R b ts n .K.
9. Int r a io con p etration t s s a
f d
r ach.
Can. e c nic l J.
4 (11), 133 1 55
v
1 ,
24 37, N ti al A
Was n
F =2, 1
F =2
FS
d
= ,
P
S ATIC� N SI –
044 , K
v
=‐ 02 )
S ,
PSE OS T C�A A YSI
,0 �e
[m
e smic
ow
side the embankment. The method of
Morgenstern and Price (1965) was used in the analyses. The
Penet
Robertson
appro
Senneset
Para
1235,
Depth
Distance�[m]�
seismic conditions.
seepage flow in


