1480
Proceedings of the 18
th
International Conference on Soil Mechanics and Geotechnical Engineering, Paris 2013
40 m apart, in order to obtain the corresponding dispersion
curve of each site. The geophones were connected to a data
acquisition system Geometric Geode, were the ground
vibrations were simultaneously recorded. The 10 kg hammer
was used for distances between geophones up to 16 m and the
63.5 kg weight was used for the longer distances. Figure 1
shows the setup instrumentation in one of the sites, where is
possible to see a geophone and the tripod in the back.
Before the tests were carried on, two calibration tests were
conducted in two sites where the shear wave velocity was
already measured with Downhole tests. A good correlation was
observed between the shear wave velocity profiles, taking into
account that in both cases the shear wave velocity presented a
decrease in the velocity at certain depths. The Vs30 obtained
with both methods presented a difference of 5 and 16% in each
case, which is considered a reasonable error.
The SASW method requires good interpretation of the
recorded data to obtain a reasonable dispersion curve.
Therefore, it is very important to consider that this method
requires qualified and trained professionals.
Figure 1. SASW instrumentation setup in one of the sites.
3 RESULTS.
Table 1 presents the location of each seismic station where the
tests were conducted and the corresponding Vs30 that was
estimated through the SASW method.
Table 1. Locations where the SASW method were conducted and
corresponding Vs30.
Station
Latitude
(°)
Longitude
(°)
V
S30
(m/s)
Peñalolén
-33.50
-70.58
337
Puente Alto
-33.58
-70.58
510
Mirador
-33.44
-70.65
583
Antumapu
-33.57
-70.63
441
Curicó
-34.98
-71.24
447
Hualañé
-34.75
-71.80
505
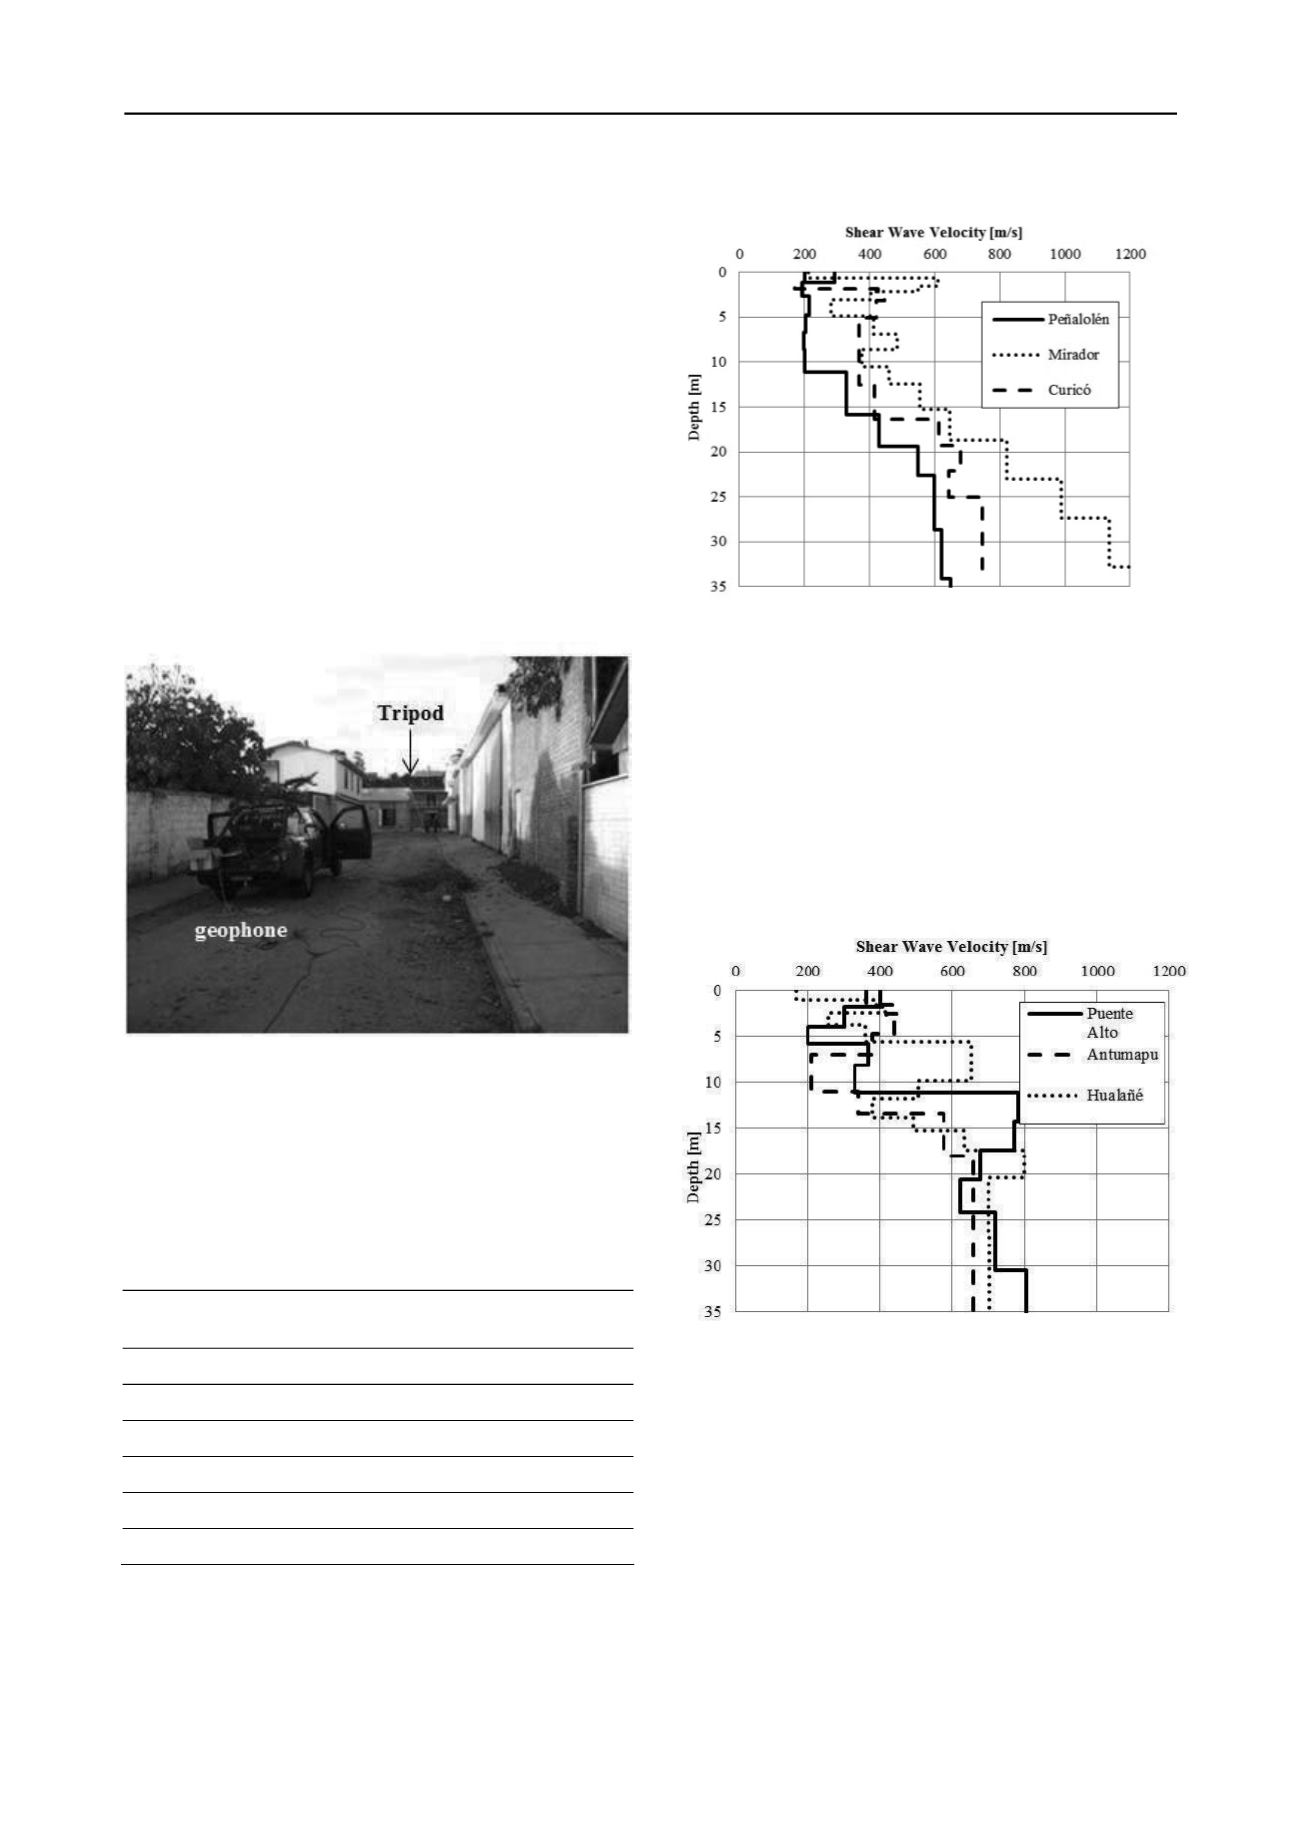
Figure 2 shows the estimated shear wave velocity profile in
Peñalolén, Mirador and Curicó, sites where the shear wave
velocity increased monotonically with depth. The Peñalolén and
Mirador sites are located in Santiago. The Curicó site is located
in the hospital of Curicó, located in the VII region, south of
Figure 2. Shear wave velocity profile, velocity increasing monotonically
with depth.
Santiago. These sites area located on gravely soils associated to
fluvial deposits.
Figure 3 shows the estimated shear wave velocity profile in
Puente Alto, Antumapu and Hualañé, sites where the shear
wave velocity does not increases monotonically. Puente Alto
and Antumapu sites are located in Santiago, and their soils
correspond to gravelly deposits. Hualañé site is located in the
hospital of Hualañé, in the VII region. It is expected that the soil
in this area corresponds to granular soils with layers associated
to colluvial deposits. In these three sites the velocity profiles
indicate the existence of less rigid layers in between.
Figure 3. Shear wave velocity profile, velocity not increasing
monotonically with depth.
4 ANALYSES.
Table 2 shows the predominant period and maximum pseudo
acceleration of the response spectrum associated to the six sites
analyzed.
Figure 4 shows the response spectrum (Boroschek 2010)
associated to the three sites that present a shear wave velocity
increasing monotonically with depth, Peñalolén, Mirador and
Curicó. These sites present acceleration response spectrums
with a clearly defined peak in a small range of periods. Beyond
these periods, the pseudo acceleration decreases consistently
with the period.


