1481
Technical Committee 203 /
Comité technique 203
Table 2. Predominant period and maximum pseudo acceleration.
Station
Predominant
period (s)
Max Pseudo-
acceleration (g)
Peñalolén
0.33
1.23
Puente Alto
0.28
0.91
Mirador
0.23
0.64
Antumapu
0.2
1.06
Hualañé
0.15
1.92
Curicó
0.25
1.68
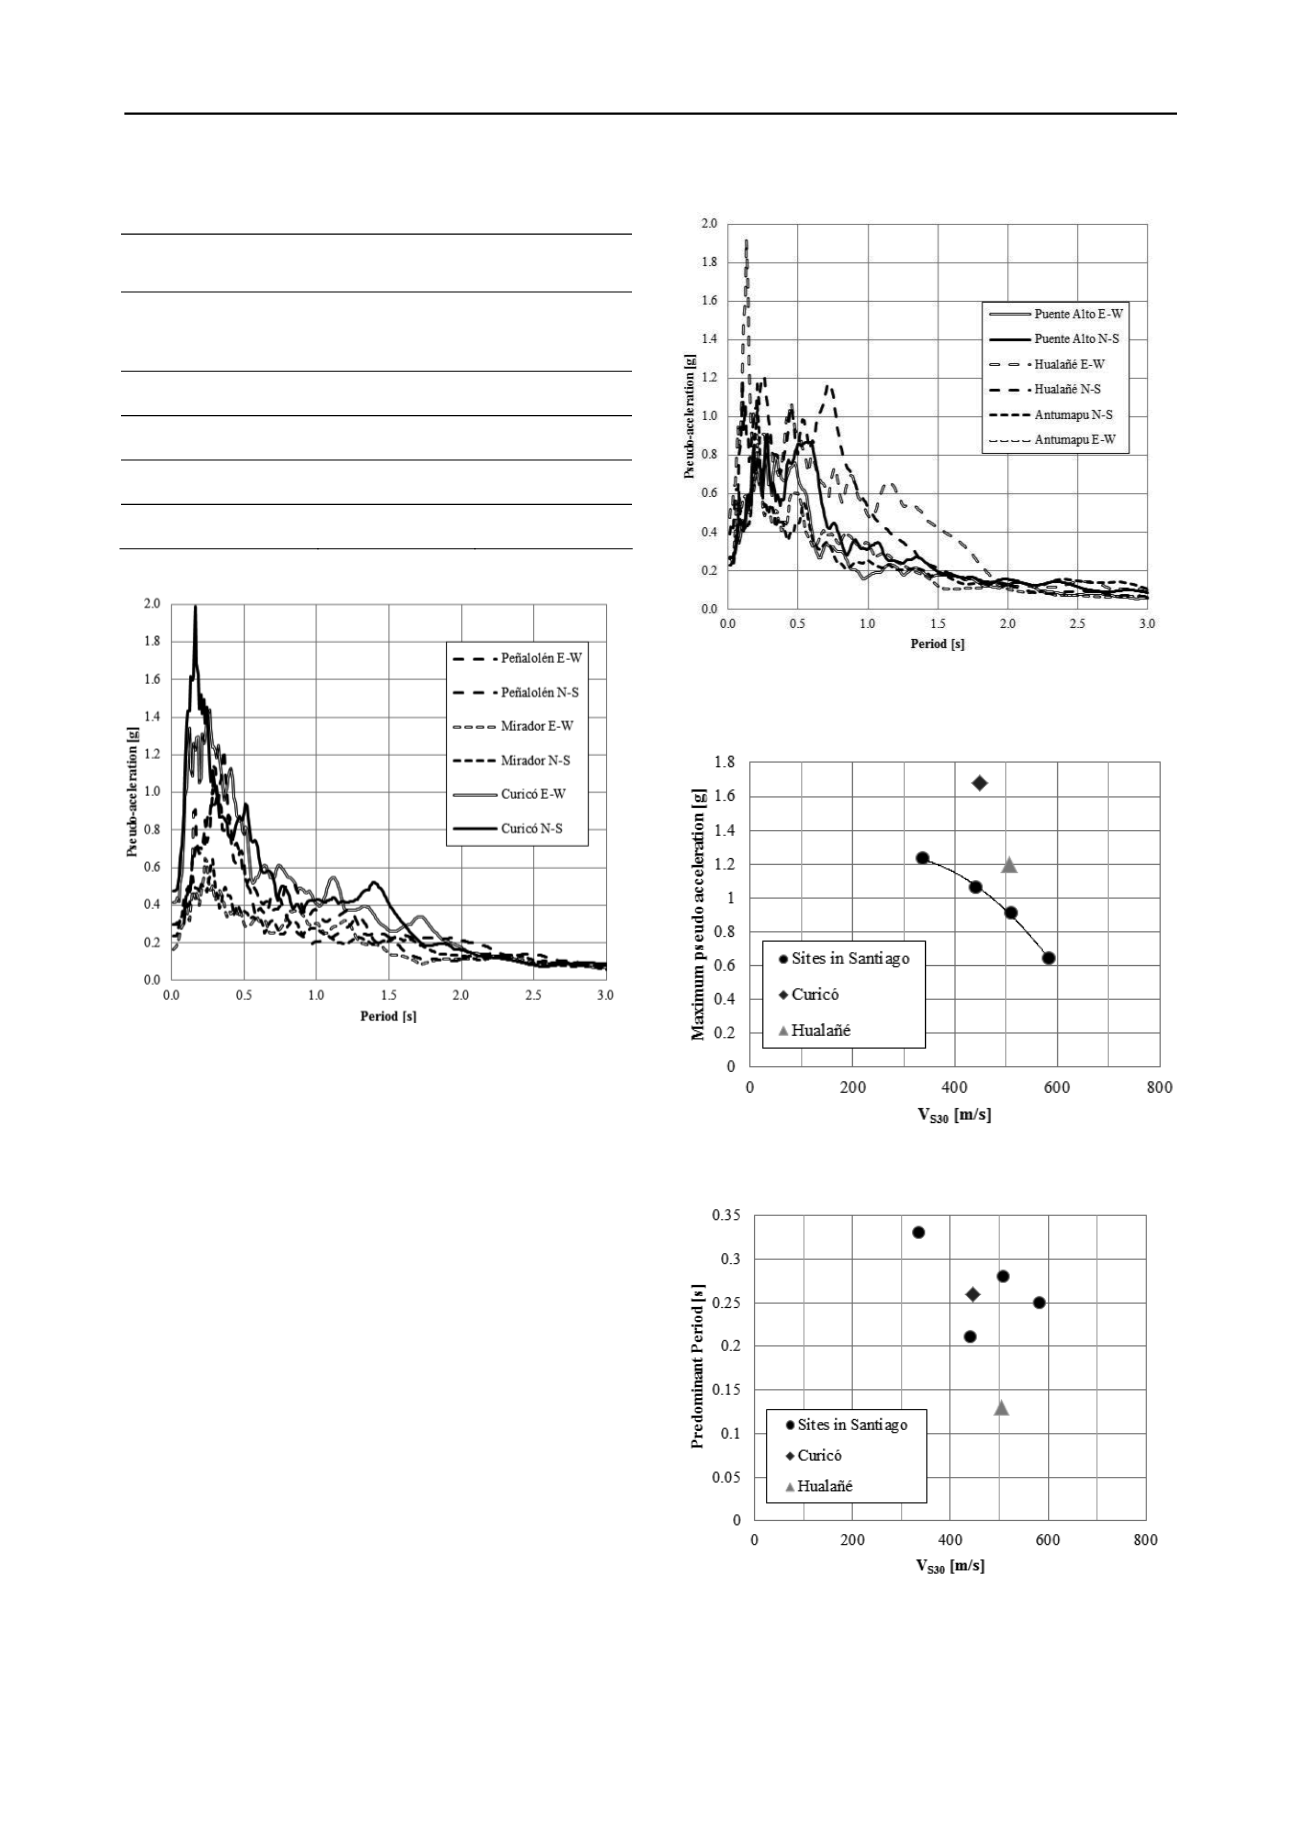
Figure 4. Acceleration response spectrum of the sites that present a
shear wave profile increasing monotonically with depth.
Figure 5 shows the response spectrum (Boroschek 2010)
associated to the three sites that present a shear wave velocity
that does not increases monotonically with depth, Puente Alto,
Antumapu and Hualañé. In these sites the acceleration response
spectrum presents more than one peak with large pseudo
acceleration. This response is believed to be associated to the
soil profile and the fact that less rigid layers are located at
certain depths, based on the SASW results. This type of profiles
should be responsible that the deposit does not present only one
predominant period associated to the whole deposit, but more
than one. This correlation indicates that soil deposits with shear
wave velocity that increases and decreases with depth would
require a wider plateau in its design response spectrum to take
into account that there is more than one peak.
Figure 6 shows the pseudo acceleration versus Vs30. It is
possible to observe that there is no clear correlation between the
pseudo acceleration and Vs30. However, if only the sites
located in Santiago, in places with a similar geological
formation, are considered, it is possible to observe a very good
correlation. In this case, the pseudo acceleration decreases when
the parameter Vs30 increases, as expected. It is important to
mention that all these sites are flat and no topographic
amplification is expected.
Figure 7 shows the predominant period as a function of the
parameter Vs30. It is possible to observe that there is no
correlation between them. The period of a deposit depends on
several variables, like the depth to the rock, the shear wave
velocity profile up to the rock, among others. Therefore, this
lack of correlation with the parameter Vs30, which depends
only of the soil profile in the first 30 m, is actually expected.
Figure 5. Acceleration response spectrum of the sites that present a
shear wave profile not increasing monotonically with depth.
Figure 6. Pseudo acceleration versus Vs30.
Figure 7. Predominant period versus Vs30.
5 CONCLUSIONS.
The main conclusions of this work are that:
The SASW method was successfully implemented to obtain
shear wave velocity profiles up to 30 m depth. This method is


