1477
Technical Committee 203 /
Comité technique 203
soil using very stiff beam column elements. Superstructure mass
at top of pile is 20 ton.
Input motion is in the form of sinus wave with PGA of 0.15g
and frequencies of 2 and 5 Hz with duration of 10 sec and is
applied to the base of the model.The response of system is
calculated for a 15 sec time period.
To verify the suitibility of model in reproducing logical
responses, a centrifuge test carried out byWilson et al.named
Csp3 for Event Jwas selectedand the responses of excess pore
pressure and bending moments are compared.
As shown in Figures 7and 8,results of model for excess pore
presure ratio and pile bending moment are in relatively good
agreement with those of centrifuge tests. So the model is
capable of predicting soil behavior under dynamic loading as
well as pile responses.
Table 1.Sand parameters used in this study
MODEL PARAMETER D
R
= 75 % D
R
= 40 %
REFERENCE SHEAR
MODULUS (KPA)
13
X
10
4
9
X
10
4
REFERENCE BULK
MODULUS (KPA)
26
X
10
4
22
X
10
4
FRICTION ANGLE
(DEGREE)
36.6
32
PT ANGLE (DEGREE)
26
26
CONTRACTION PARA 1
0.013
0.067
CONTRACTION PARA 2
0
0.23
DILATION PARA 1
0.3
0.06
DILATION PARA 2
0
0.27
PEAK SHEAR STRAIN
10 %
10 %
PERMEABILITY (M/S)
6.6
X
10
-5
6.6
X
10
-5
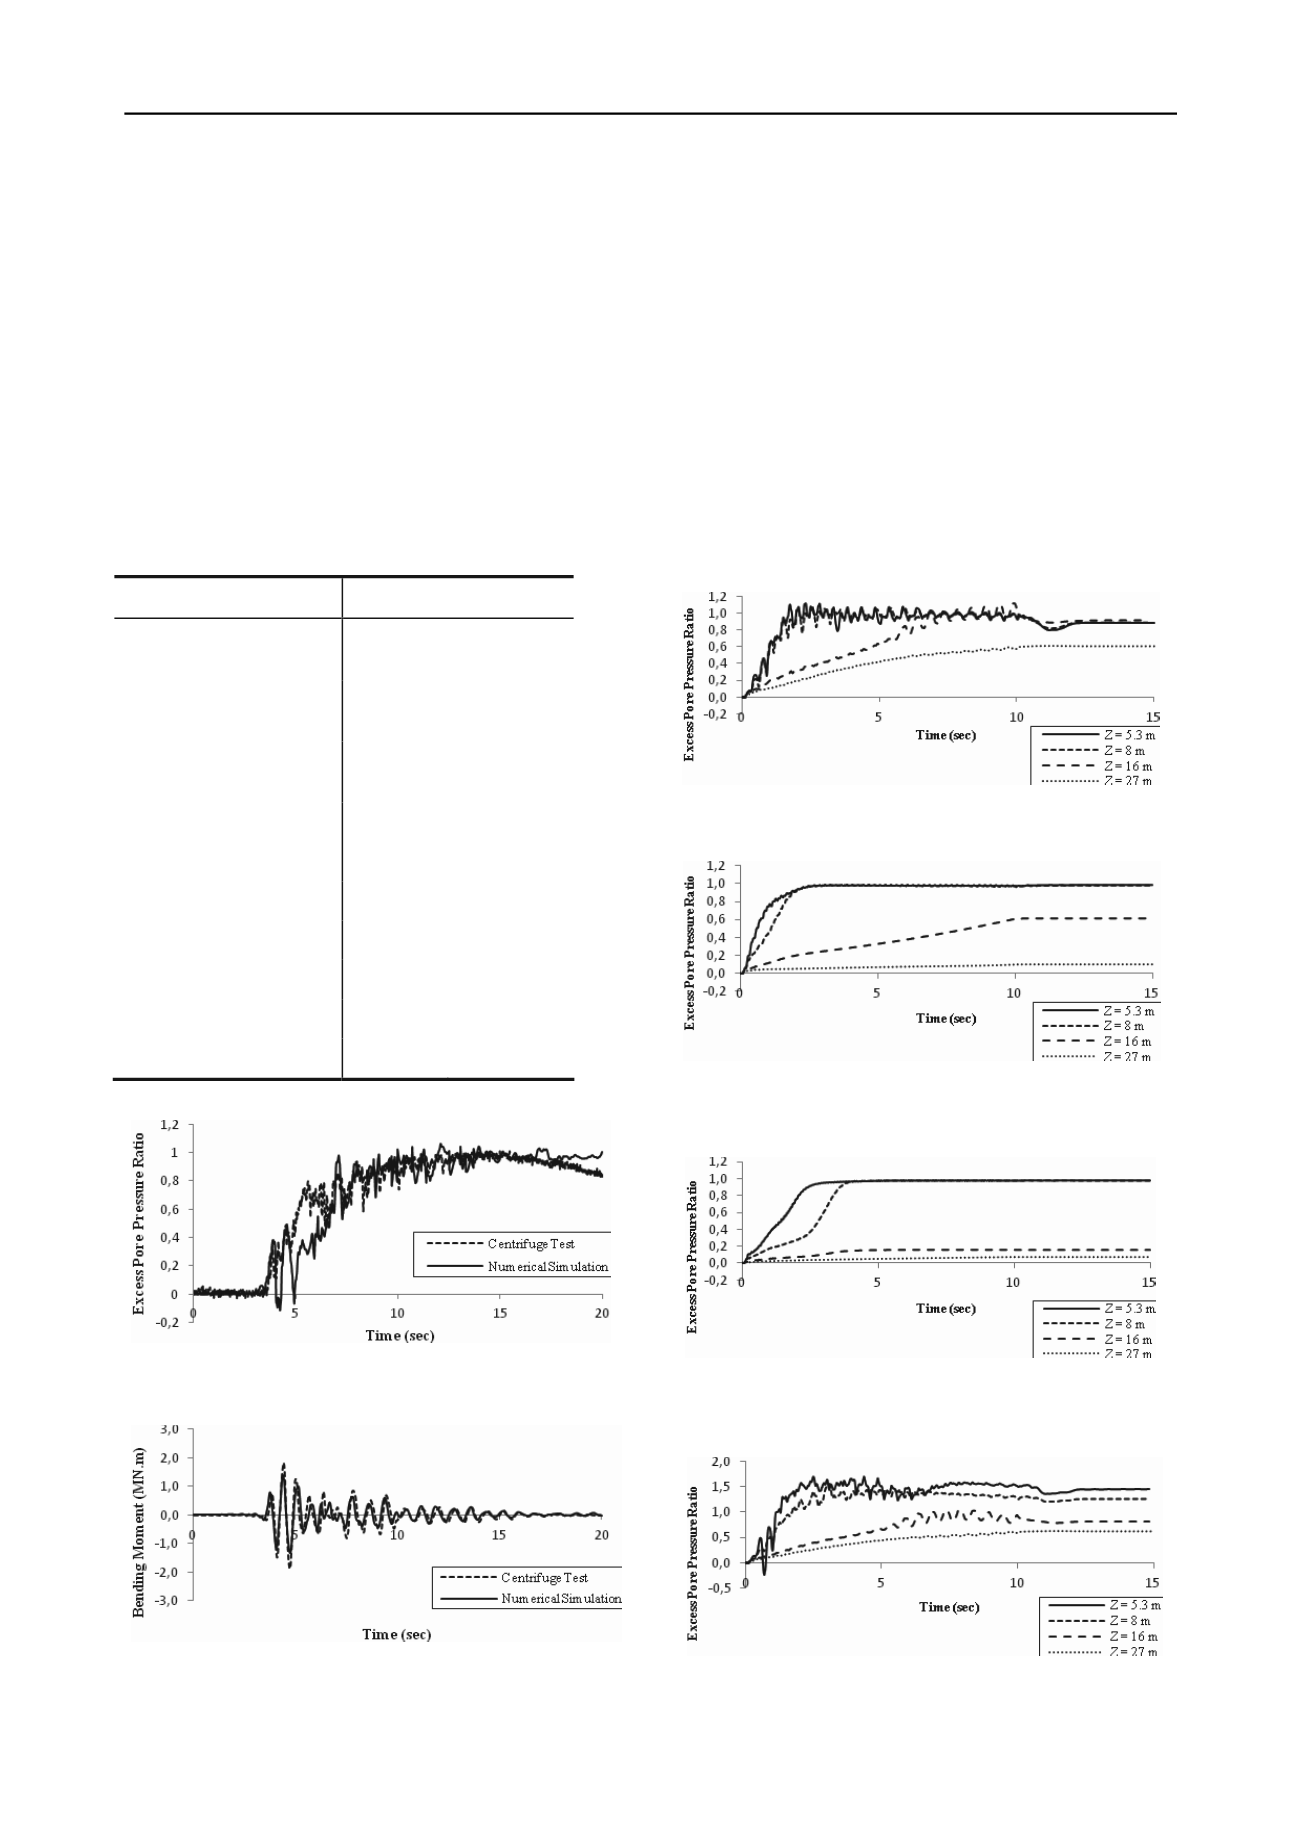
Figure 7.R
u
time history at 1 m depth and 6.6 m horizontal distance
from pile wall.
Figure 8.Bending moment time history response of pile at 4 m depth
from ground surface.
4 SIMULATION AND RESULTS
Soil and pile response are dicussed in 2 sections. In the first
section, R
u
is defined as ratio of the excess pore water pressure
to the initial effective vertical stress (R
u
=Δu/σ
’
0v
). When R
u
reachesunity, the soil is totally liquefied and has no more shear
strength.
4.1
Excess pore pressure
It is observed from Figures 9, 10 and 11 that in the first layer
with thickness of 8 m,complete liquefaction happens after a few
seconds of excitation which means low D
r
sand at shallower
depths is liquefied under loadings of any frequency, although it
is worth mentioning that at higher frequencies, it happens a little
later. This can be relatedto oscillation of soil particles to a lower
limit at higher frequencies according to Yao et al. (2004).
Figure9.R
u
time history at 5.3,8 and 27 m depth and 12 m horizontal
distance from pile under base motion of 2 Hz frequency for Case I.
Figure 10.R
u
time history at 5.3,8,16 and 27 m depth and 12 m
horizontal distance from pile under base motion of 5 Hz frequency for
Case I.
Figure 11.R
u
time history at 5.3,8,16 and 27 m depth and 12 m
horizontal distance from pile under base motion of 10 Hz frequency for
Case I.
Figure 12.R
u
time history at 5.3,8,16 and 27 m depth and 12 m
horizontal distance from pile under base motion of 2 Hz frequency for
Case II.


