 
          1485
        
        
          Technical Committee 203 /


            Comité technique 203


          � �
        
        
          �
        
        
          �i���������������
        
        
          ��i���������
        
        
          � � � � �
        
        
          ����i�����������
        
        
          � �i���������
        
        
          � � � � � � �
        
        
          ����i�����������
        
        
          ��i�����������
        
        
          � � �
        
        
          P��Riv���
        
        
          P��Riv���
        
        
          P��Riv���
        
        
          - the geometry of the embankment (Figure 4): in particular, the
        
        
          height (variable from 2 to 23 m) - upstream and downstream -
        
        
          and the number of berms;
        
        
          - the kind of foundation soil, upstream and downstream;
        
        
          - the seismic input from local site response;
        
        
          - the presence of a diaphragm wall at the embankment toe,
        
        
          downstream;
        
        
          - the reported historical failures.
        
        
          A total of 43 significant sections was finally selected for the
        
        
          stability analyses.
        
        
          Figure 4. Typical geometries of the Po riverbanks.
        
        
          4 GEOTECHNICAL CHARACTERIZATION
        
        
          ical
        
        
          different, predominantly
        
        
          -
        
        
          minantly silty sediments (


            SBT


          zone 4), with
        
        
          -
        
        
          ayey sediments (


            SBT


          zone 3), with
        
        
          y,
        
        
          de
        
        
          Stratigraphic soil profiling as well as geotechn
        
        
          characterization of the riverbank sediments and the surrounding
        
        
          subsoil mainly relied on in situ tests, with special reference to
        
        
          piezocone data. In addition, laboratory test results were used as
        
        
          supporting reference data in order to validate the CPTU-based
        
        
          correlations adopted in estimating the relevant soil parameters.
        
        
          In this procedure, detailed stratigraphic profiles were derived by
        
        
          applying the well-known and newly revised classification
        
        
          framework developed by Robertson (2009), based on the stress
        
        
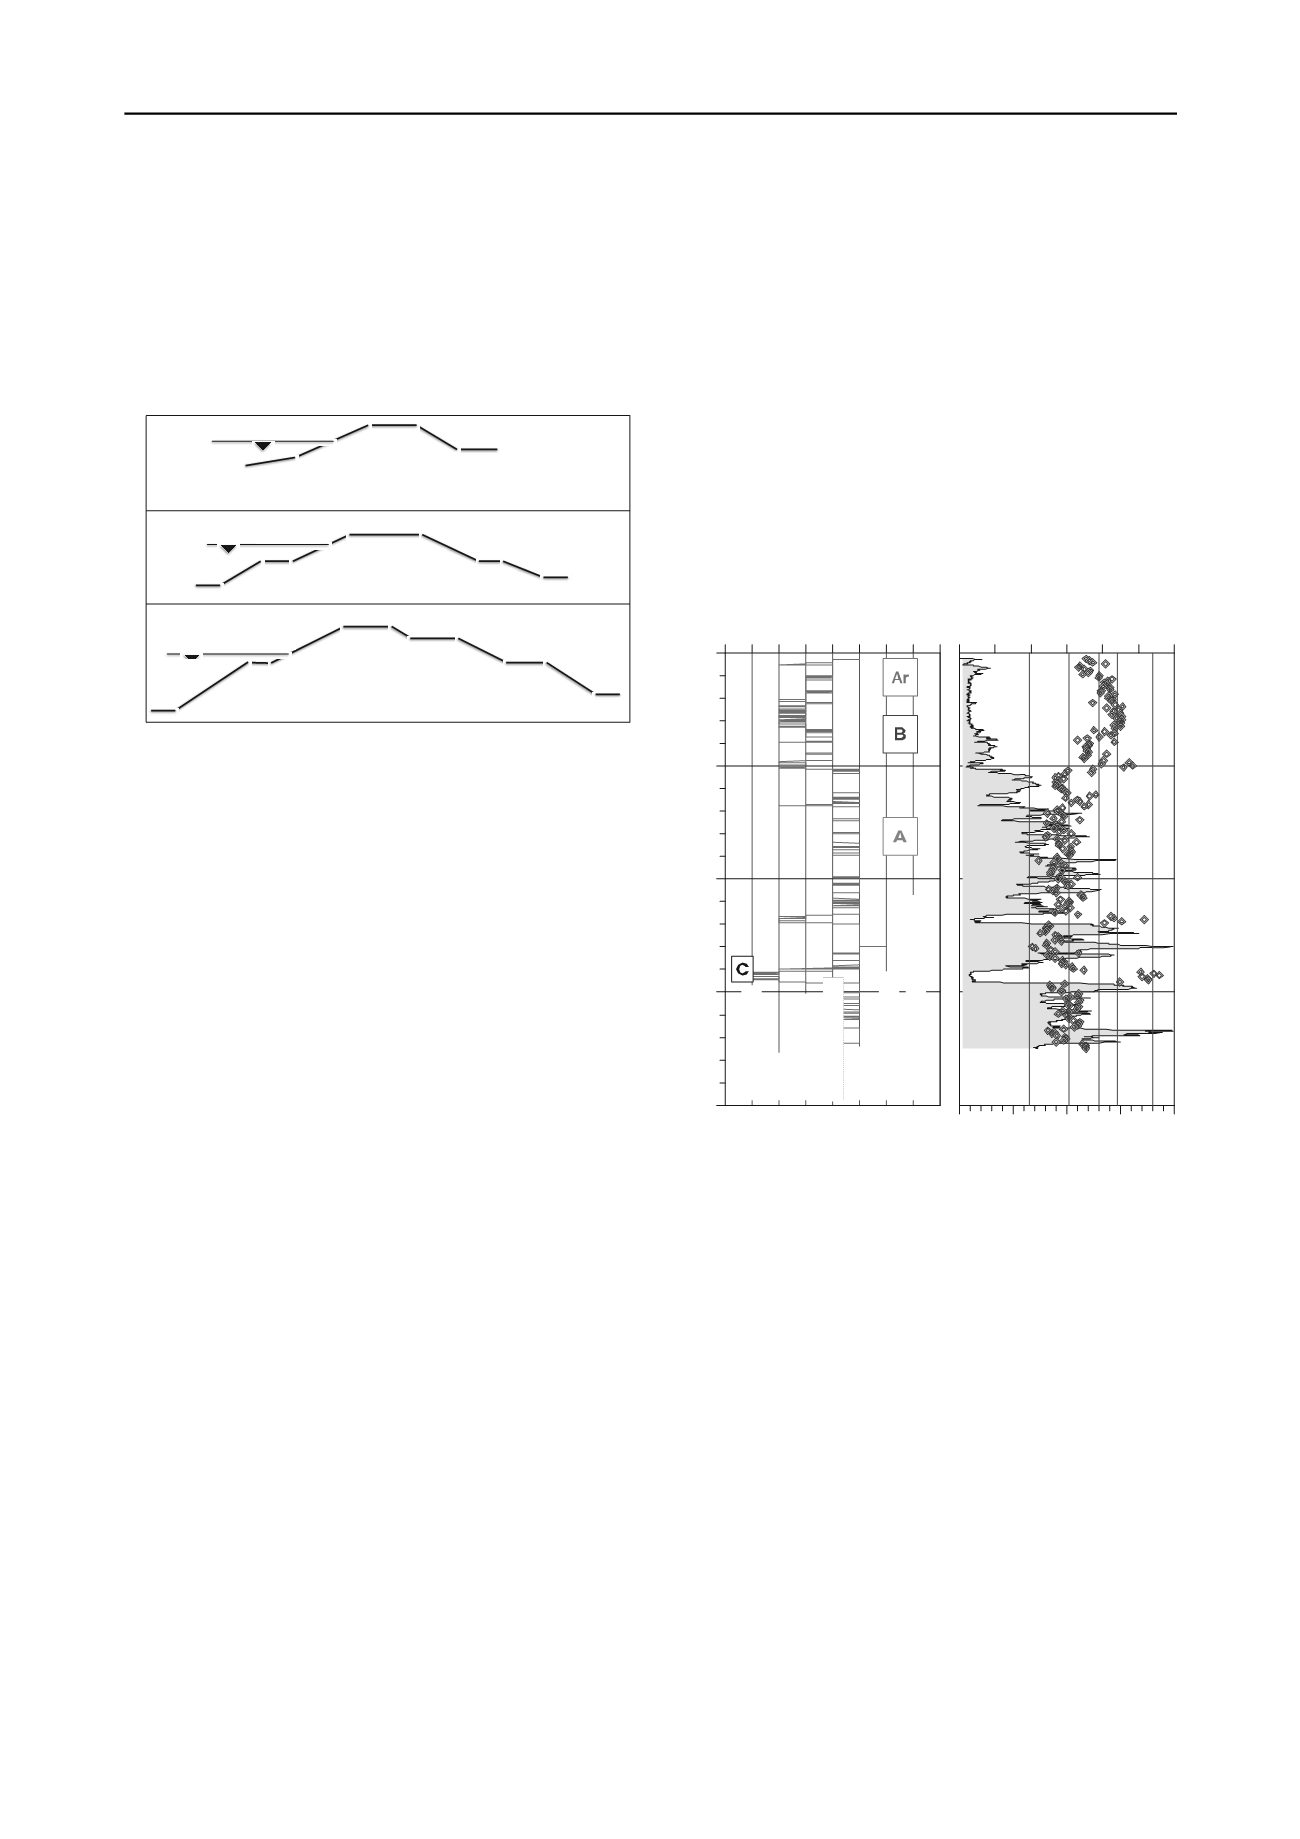
          normalized CPTU measurements. As an example, Figure 5
        
        
          provides a typical output of the method, consisting in a profile
        
        
          of the different Soil Behaviour Type (SBT) classes detected
        
        
          along the vertical in conjunction with the CPTU-based material
        
        
          index


            I


            cn


          values. The analysis of such profiles allows identifying
        
        
          a number of homogeneous soil layers, which generally turn out
        
        
          to agree fairly well with the available geological classification.
        
        
          According to the analyses carried out so far, the following
        
        
          typical soil units were identified:
        
        
          - Unit A
        
        
          r
        
        
          , a complex alternation of
        
        
          coarse grained sediments such as sands, silty sands, silts to
        
        
          clayey silts, forming the riverbanks;
        
        
          Unit A, sand;
        
        
          - Unit B, predo
        
        
          sandy and clayey lenses.
        
        
          Unit C, predominantly cl
        
        
          occasional presence of peat and organic soils (


            SBT


          zone 2).
        
        
          Geotechnical properties describing soil state, stress histor
        
        
          formation and strength characteristics were derived from
        
        
          piezocone tests using empirical correlations. Attention was
        
        
          particularly focused on the estimate of the effective stress
        
        
          strength parameters to be used in the stability analyses, hence
        
        
          various transformation models were considered in order to
        
        
          relate test measurements to the most appropriate soil property
        
        
          value. As regards friction angle in sands, empirical relationships
        
        
          relying on relative density were considered, together with the
        
        
          well-known normalized cone resistance-based correlations
        
        
          proposed by Robertson & Campanella (1983) and later by
        
        
          Kulhawy & Mayne (1990). In fine-grained soils, the effective
        
        
          stress friction angle was determined from the normalized CPT
        
        
          readings


            Q


            t


            = (q


            t


            - σ


            v0


            )/σ'


            v0


          and


            Bq =Δu/(q


            t


            - σ


            v0


            )


          (Senneset


            et al.


          1989). It is worth observing that, in order to develop a
        
        
          probabilistic stability analysis of riverbanks, the adopted soil
        
        
          characterization procedure includes a rather straightforward
        
        
          method for the assessment of inherent soil variability.
        
        
          According to such approach, the geotechnical property
        
        
          variability is concisely described by the coefficient of variation
        
        
          (Phoon & Kulhawy, 1999). Thus, the geotechnical
        
        
          characterization of each soil unit needs the definition of the
        
        
          mean value of the soil property together with the associated
        
        
          standard deviation


            SD


          and coefficient of variation


            CoV


          . From
        
        
          the interpretation of the large amount of available data, it turns
        
        
          out that unit A is typically characterized by a mean friction
        
        
          angle φ′


            m


          = 35°÷36° and a standard deviation SD


          2°; unit B
        
        
          by φ′


            m


          32°and SD


          1°, unit C by φ′


            m


          24° and SD


          2°.
        
        
          Finally, as regards the sandy-silty mixtures forming the
        
        
          riverbanks, typical values of mean friction angle φ′


            m


          are 32°
        
        
          with a standard deviation SD


          1.5°.
        
        
          1 2 3 4 5 6 7 8 9


            Soil Behaviour Type Zone


            (Robertson, 2009)


          40
        
        
          30
        
        
          20
        
        
          10
        
        
          0


            Depth (m)


              q


              t


            Sands


            Sand Mixtures


            Silt Mixtures


            Clays


            Organic Soils


            Gravelly Sands


            Very Stiff/Clayey Sands


          0 5 10 15 20 25 30


            Corrected Cone Resistance


              q


              t


            (MPa)


          0 1 2 3


            SBT Index,


              I


              cn


          4


            SBT zone


            7 6 5 4 3 2


              I


              cn


          Figure 5. Results from CPTU-based classification
        
        
          5 LABORATORY TESTING
        
        
          of the CPTU-based empirical
        
        
          ratory testing for lithologic
        
        
          Unit A
        
        
          r
        
        
          *.
        
        
          In order to verify the reliability
        
        
          relationships adopted in the study and the intrinsic variability of
        
        
          the geotechnical properties, estimated for each lithological unit,
        
        
          laboratory tests were performed on undisturbed samples taken
        
        
          at different depths and from boreholes even very distant to each
        
        
          other. Seventy undisturbed samples were analyzed, 19 from
        
        
          lithologic Unit Ar*, 17 from Unit B, 16 from Unit C, 2 from
        
        
          Unit D2 and 16 from Unit A. Laboratory testing program
        
        
          included identification and classification tests, oedometric tests,
        
        
          different types of shear strength tests (Direct Shear Test, DST,
        
        
          and triaxial tests, TxCIU, TxCID), resonant column (RC) and
        
        
          torsional cyclic tests. The experimental results from the
        
        
          representative samples of lithologic Units Ar* are shown in
        
        
          Table 1. In particular, for each property, the number of tested
        
        
          specimens, mean, minimum and maximum values, standard
        
        
          deviation and coefficient of variation are reported. Kind of
        
        
          testing, number of specimens, values of the parameters and
        
        
          correlation coefficients are provided for drained and undrained
        
        
          shear strength and for normalized shear modulus and damping
        
        
          ratio versus shear strain relationships.
        
        
          Table 1. Geotechnical properties from labo